Fig. 9.
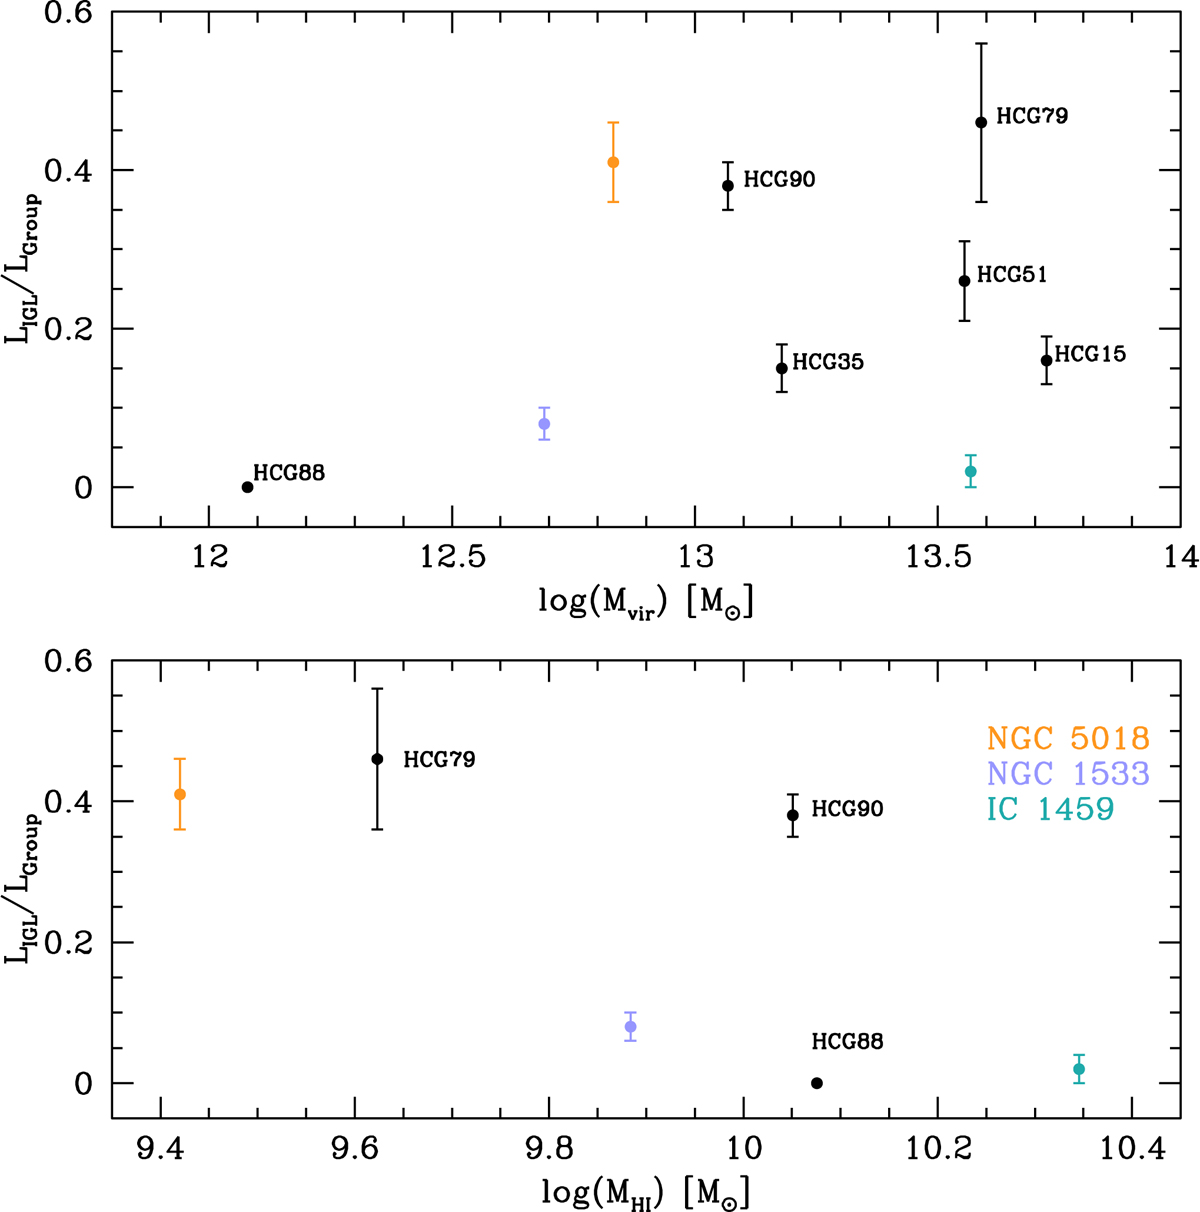
Luminosity of the IGL component normalised to the total group luminosity as a function of the total HI mass of the group (lower panel) and of the virial mass of the group (top panel), for NGC 5018 group (orange), NGC 1533 triplet (mauve), and IC 1459 group (teal). Values are compared with those for several HCGs. For HCG 79 and HCG 88 data are from Borthakur et al. (2010), Da Rocha & Mendes de Oliveira (2005), Ribeiro et al. (1998) and Nishiura et al. (2000). For the remaining HCGs, data are taken from Da Rocha et al. (2008) and Selim & Iqbal (2008).
Current usage metrics show cumulative count of Article Views (full-text article views including HTML views, PDF and ePub downloads, according to the available data) and Abstracts Views on Vision4Press platform.
Data correspond to usage on the plateform after 2015. The current usage metrics is available 48-96 hours after online publication and is updated daily on week days.
Initial download of the metrics may take a while.