Fig. 3.
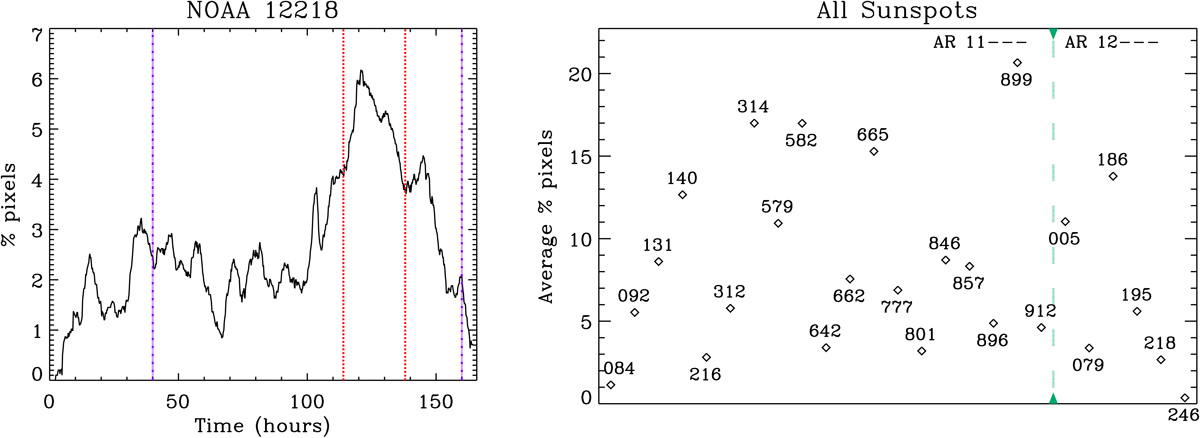
Fraction of penumbral area that satisfies the imposed conditions (see Sect. 2). Left panel: this fraction for the sunspot of NOAA AR12218 for each time step. The vertical dashed purple lines indicate the first and last panels of Fig. 2 and the red lines indicate the period of time, used as an example in the text, when the percentage of penumbral fraction suffers a large variation. Right panel: averaged penumbral fraction for each sunspot of the sample. The vertical dashed green line denotes the separation between the NOAA active regions whose number starts with 11 and those that start with 12.
Current usage metrics show cumulative count of Article Views (full-text article views including HTML views, PDF and ePub downloads, according to the available data) and Abstracts Views on Vision4Press platform.
Data correspond to usage on the plateform after 2015. The current usage metrics is available 48-96 hours after online publication and is updated daily on week days.
Initial download of the metrics may take a while.