Fig. 3
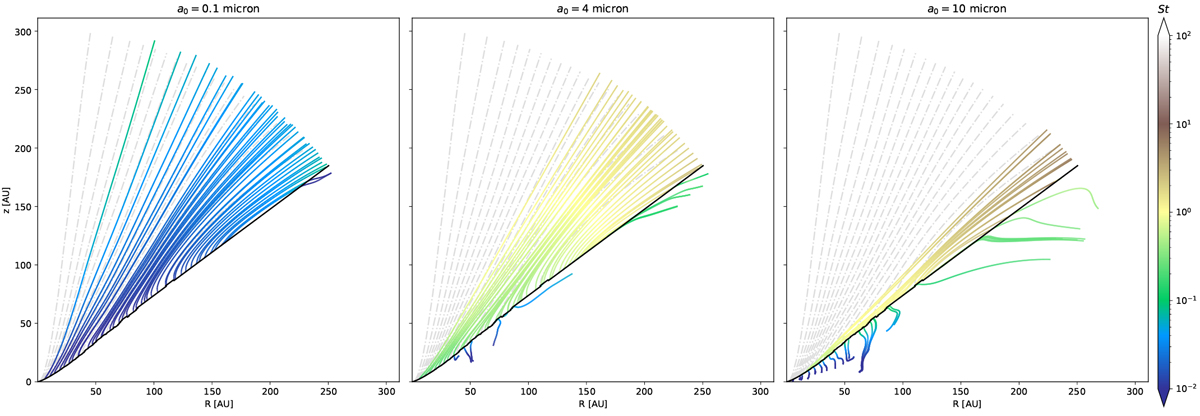
Randomly selected dust trajectories for a0 = 0.1, 4, and10 μm (left, middle, and right panels, respectively). The trajectory color represents the local value of the Stokes number. Entrained dust grains, launching from the launching region (black), migrate upwards on the colorbar the as they move to regions of lower gas density. Gas streamlines are shown in dash-dotted grey. (For all simulated grain sizes, see Fig. C.1.)
Current usage metrics show cumulative count of Article Views (full-text article views including HTML views, PDF and ePub downloads, according to the available data) and Abstracts Views on Vision4Press platform.
Data correspond to usage on the plateform after 2015. The current usage metrics is available 48-96 hours after online publication and is updated daily on week days.
Initial download of the metrics may take a while.