Fig. 2.
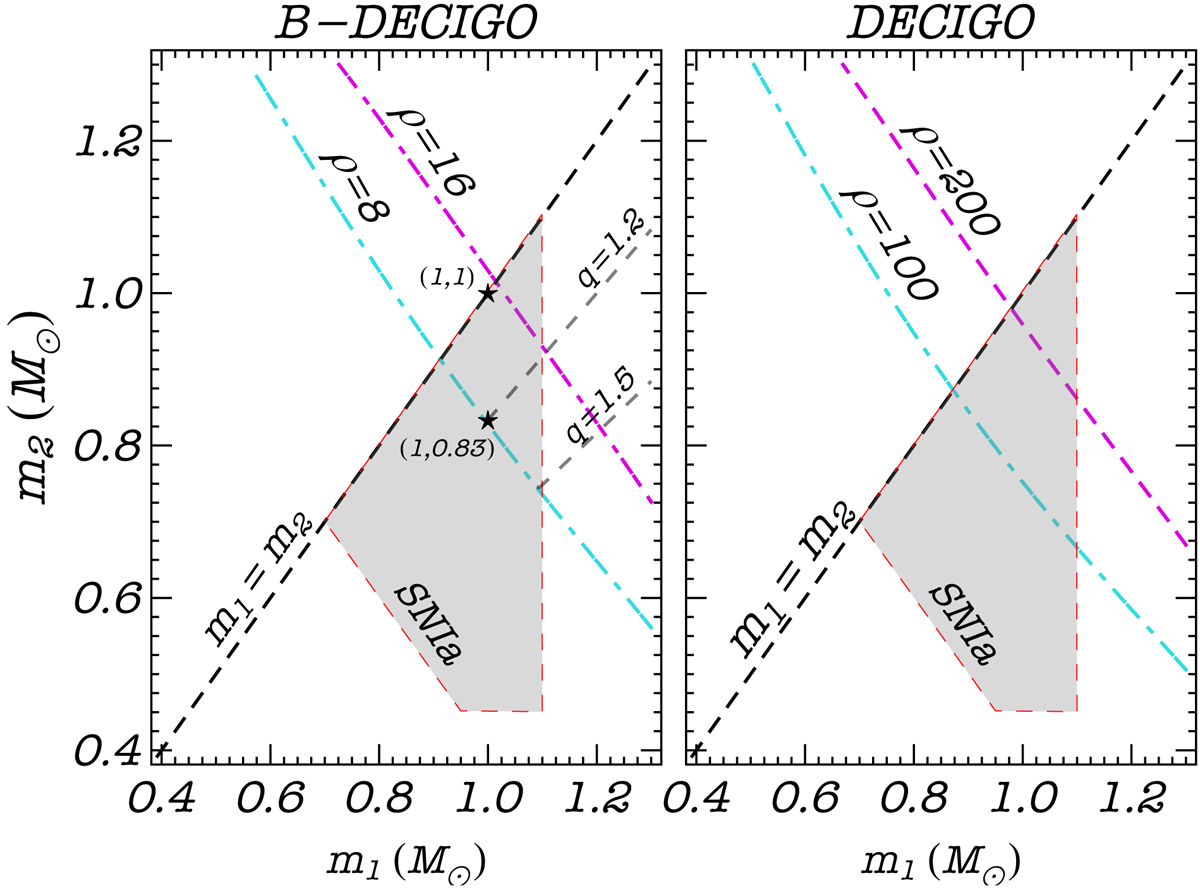
Contour lines of fixed S/N ρ as a function of the component masses m1, 2 for BWD observed by B-DECIGO (left panel) at d = 50 Mpc and DECIGO (right panel) at d = 100 Mpc. The S/N was computed by averaging over the source orientations. The shaded gray region identifies the region where the coalescence of the two stars may lead to supernovae Ia events (Postnov & Yungelson 2014). We also show lines of constant mass ratio q = m1/m2.
Current usage metrics show cumulative count of Article Views (full-text article views including HTML views, PDF and ePub downloads, according to the available data) and Abstracts Views on Vision4Press platform.
Data correspond to usage on the plateform after 2015. The current usage metrics is available 48-96 hours after online publication and is updated daily on week days.
Initial download of the metrics may take a while.