Fig. 1.
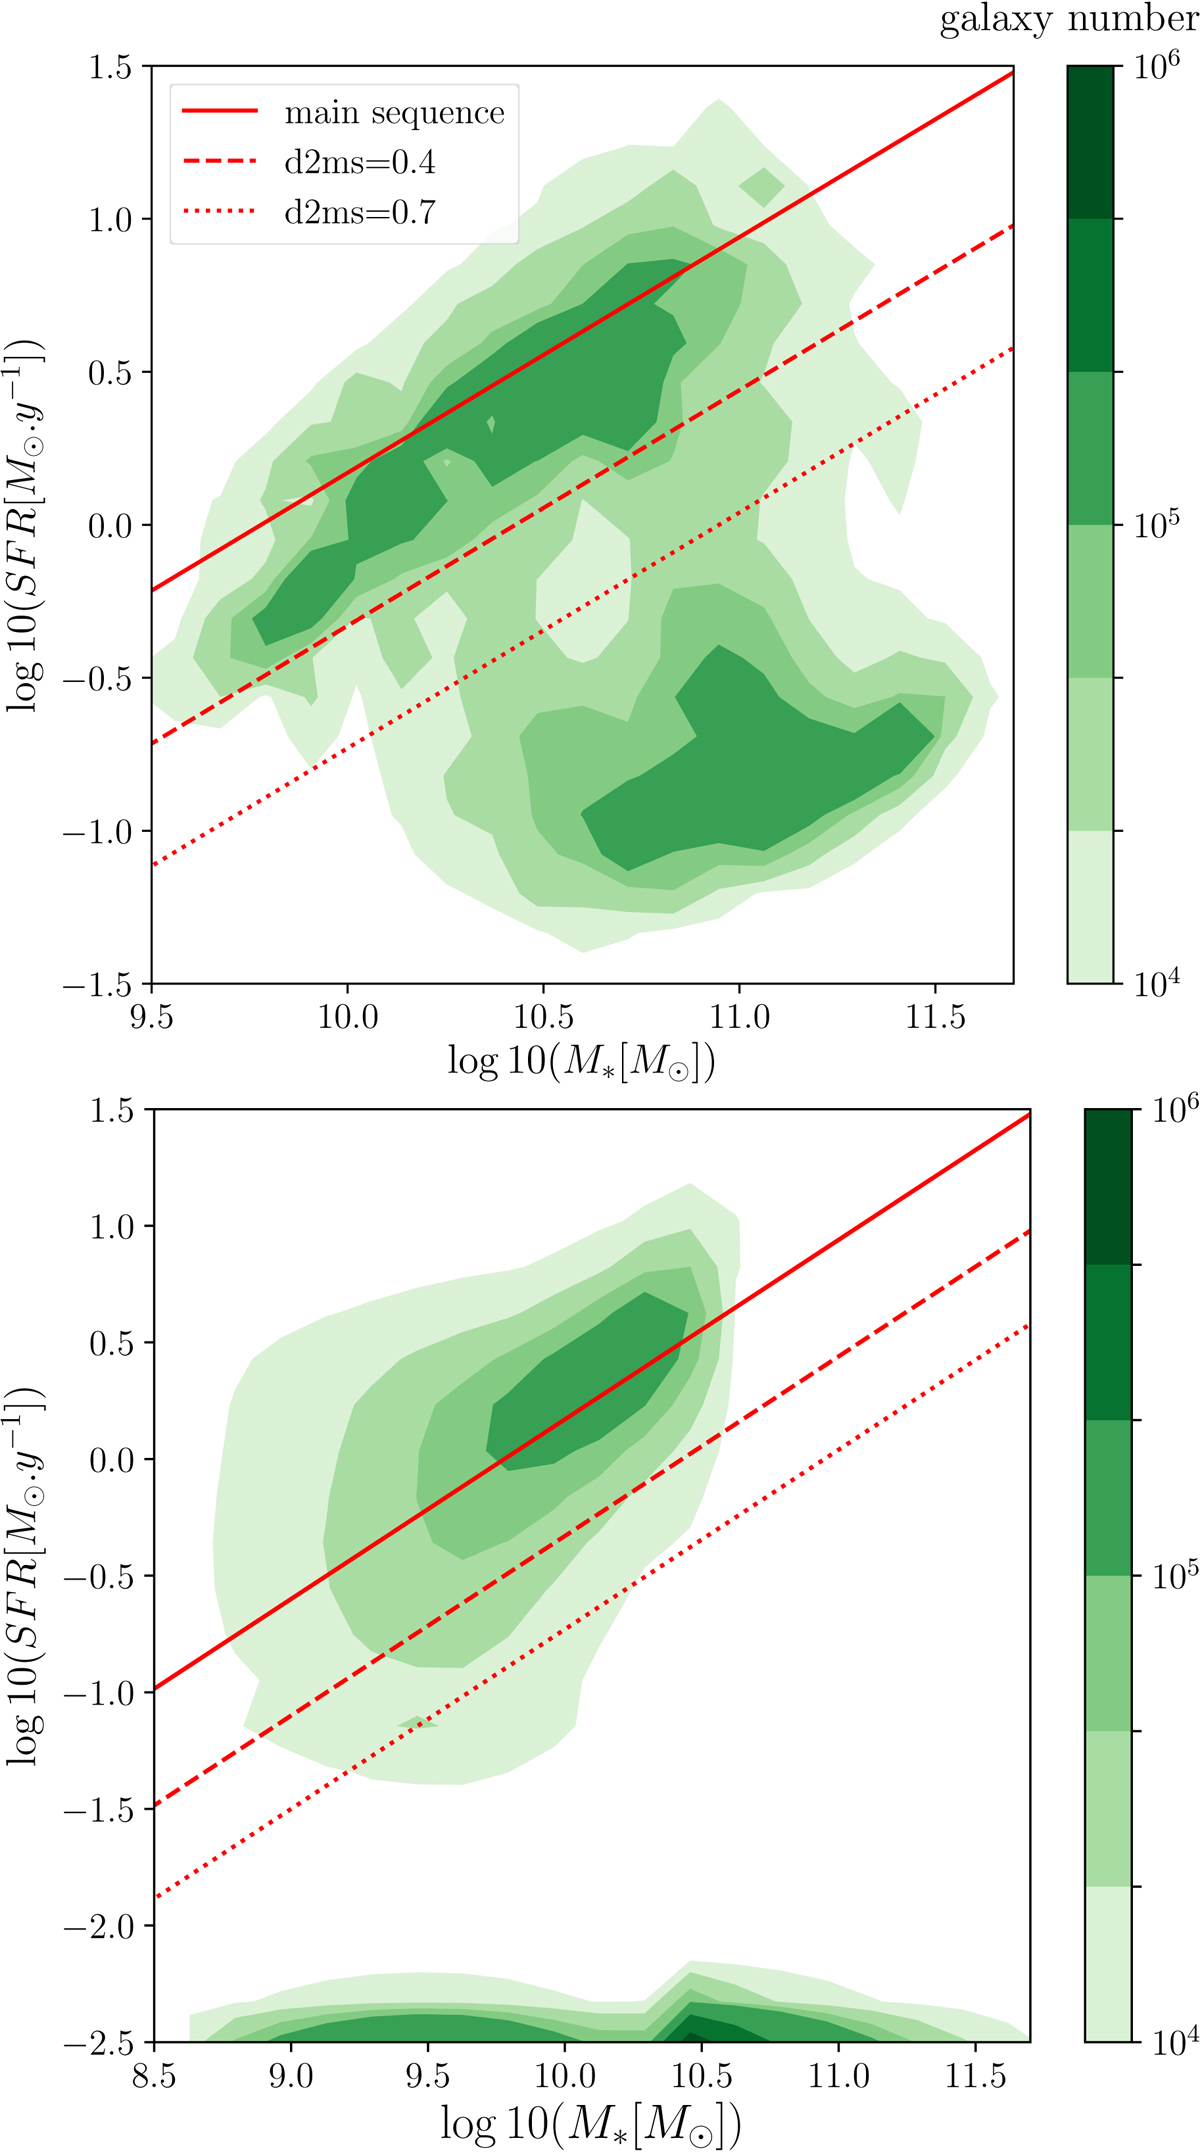
Diagram SFR vs. stellar mass for WISE × SCOSMOS datasets (top panel) and for Magneticum galaxies with 0.1 < z < 0.3 (bottom panel). The red solid line is the main sequence of SF galaxies given by Elbaz et al. (2007), and the dotted red lines show the limit such as d2ms = 0.4, and d2ms = 0.7. Bottom panel: we put artificial mock galaxies with an SFR = 0 at log(SFR) = − 2.5. The zero-SFR galaxies are the result of computational limit in the simulation.
Current usage metrics show cumulative count of Article Views (full-text article views including HTML views, PDF and ePub downloads, according to the available data) and Abstracts Views on Vision4Press platform.
Data correspond to usage on the plateform after 2015. The current usage metrics is available 48-96 hours after online publication and is updated daily on week days.
Initial download of the metrics may take a while.