Fig. 1.
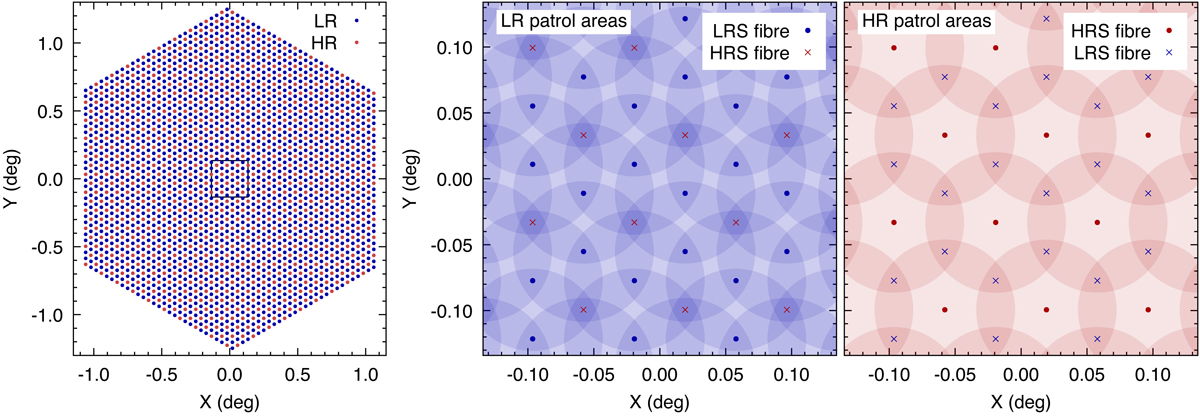
Left panel: 4MOST field of view with 1624 low-resolution (blue) and 812 high-resolution spectrograph fibres (red) at their home positions. One field of view covers 4.3 square degrees in the sky (see also Fig. 7). Black rectangle depicts the area shown in the middle and right panels. Middle and right panels: patrol area (3.2 arcmin from the fibre home position) of each low- and high-resolution spectrograph fibre, respectively. Fibre home positions are marked as points for a given resolution or as small crosses for fibres with alternative resolution. Any location in a field of view can be reached by two to six low-resolution spectrograph fibres and by one to three high-resolution spectrograph fibres. Table 1 gives the fraction of area that is covered by a given number of fibres.
Current usage metrics show cumulative count of Article Views (full-text article views including HTML views, PDF and ePub downloads, according to the available data) and Abstracts Views on Vision4Press platform.
Data correspond to usage on the plateform after 2015. The current usage metrics is available 48-96 hours after online publication and is updated daily on week days.
Initial download of the metrics may take a while.