Fig. 11.
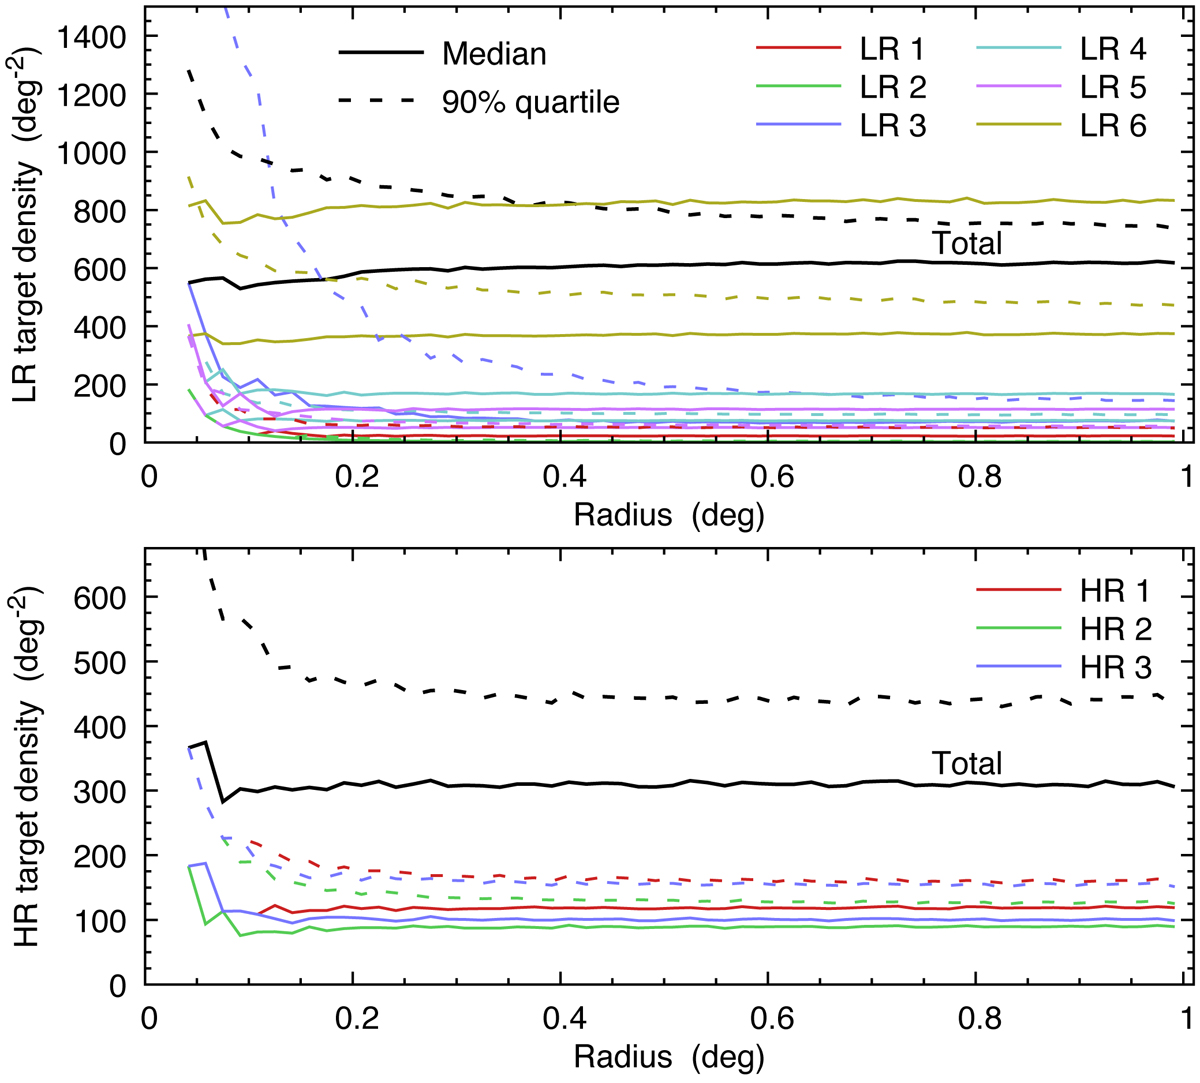
Target density on the sky for low- (upper panel) and high-resolution (lower panel) test surveys. Target density was calculated within a circle (with random location within a fixed sky area) of radius r as indicated in abscissa. Black lines show the total target density for a given resolution, coloured lines show target density for individual surveys. Solid lines show median target density on the sky, while dashed lines indicate the 90% quantiles. Due to the clustering of targets, the target density (90% quantile) increases towards small sky areas.
Current usage metrics show cumulative count of Article Views (full-text article views including HTML views, PDF and ePub downloads, according to the available data) and Abstracts Views on Vision4Press platform.
Data correspond to usage on the plateform after 2015. The current usage metrics is available 48-96 hours after online publication and is updated daily on week days.
Initial download of the metrics may take a while.