Fig. 13.
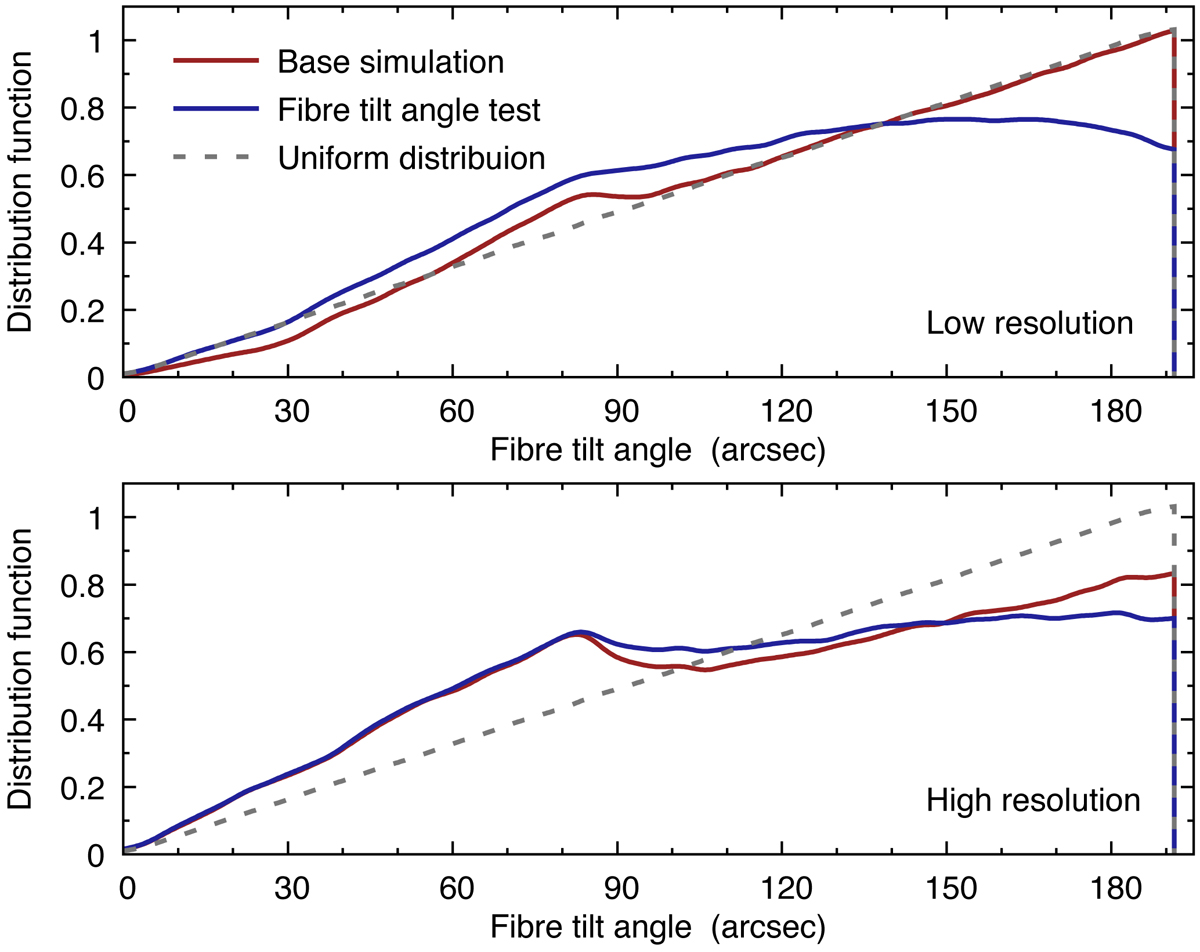
Distribution of tilt angles for low- (upper panel) and high-resolution (lower panel) spectrograph fibres. Tilt angle was measured from the fibre home position. The red line shows the distribution for the base simulation whilst the blue line shows the tilt angle distribution after introducing the non-constant ftilt(α) function (see Sect. 4.2.4 for more details). The dashed line shows the uniform distribution of tilt angles. The local bump around 80 arcsec is due to the fixed fibre pattern (see Fig. 1).
Current usage metrics show cumulative count of Article Views (full-text article views including HTML views, PDF and ePub downloads, according to the available data) and Abstracts Views on Vision4Press platform.
Data correspond to usage on the plateform after 2015. The current usage metrics is available 48-96 hours after online publication and is updated daily on week days.
Initial download of the metrics may take a while.