Fig. 15.
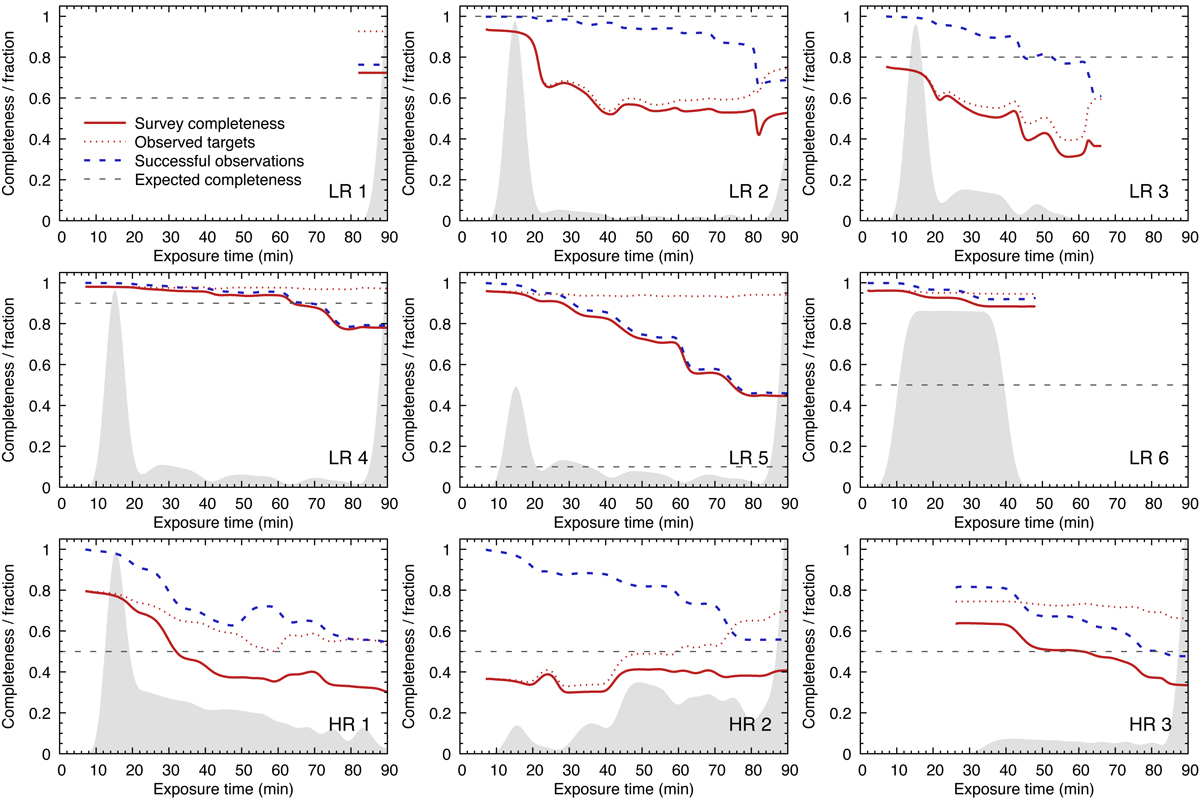
Survey completeness as a function of target exposure time. The grey area shows the distribution of exposure times for each survey. The dashed horizontal line shows the required completeness fraction (fcompl value) for each survey. The dotted red line shows the fraction of observed targets for each survey whilst the solid red line shows the fraction of successfully completed targets. The dashed blue line shows the fraction of successfully completed targets over all observed targets.
Current usage metrics show cumulative count of Article Views (full-text article views including HTML views, PDF and ePub downloads, according to the available data) and Abstracts Views on Vision4Press platform.
Data correspond to usage on the plateform after 2015. The current usage metrics is available 48-96 hours after online publication and is updated daily on week days.
Initial download of the metrics may take a while.