Fig. 18.
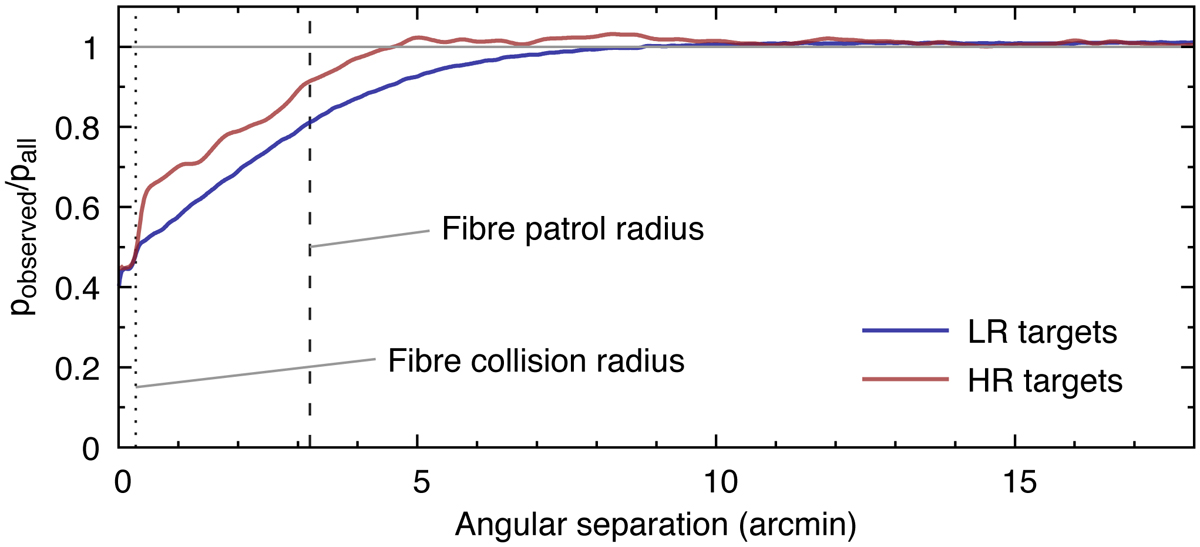
Selection of targets as a function of angular separation. The distribution of angular separation of observed targets was divided by the distribution of angular separation of all targets. The blue line shows low-resolution targets and the red line shows high-resolution targets. The vertical dashed line shows the fibre patrol radius (3.2 arcmin) and the vertical dotted line shows the fibre collision distance (17 arcsec). Due to the fixed fibre pattern, targets with smaller angular separation are less likely to be targeted. Targeting efficiency rapidly drops for targets closer than fibre collision distance.
Current usage metrics show cumulative count of Article Views (full-text article views including HTML views, PDF and ePub downloads, according to the available data) and Abstracts Views on Vision4Press platform.
Data correspond to usage on the plateform after 2015. The current usage metrics is available 48-96 hours after online publication and is updated daily on week days.
Initial download of the metrics may take a while.