Fig. 2.
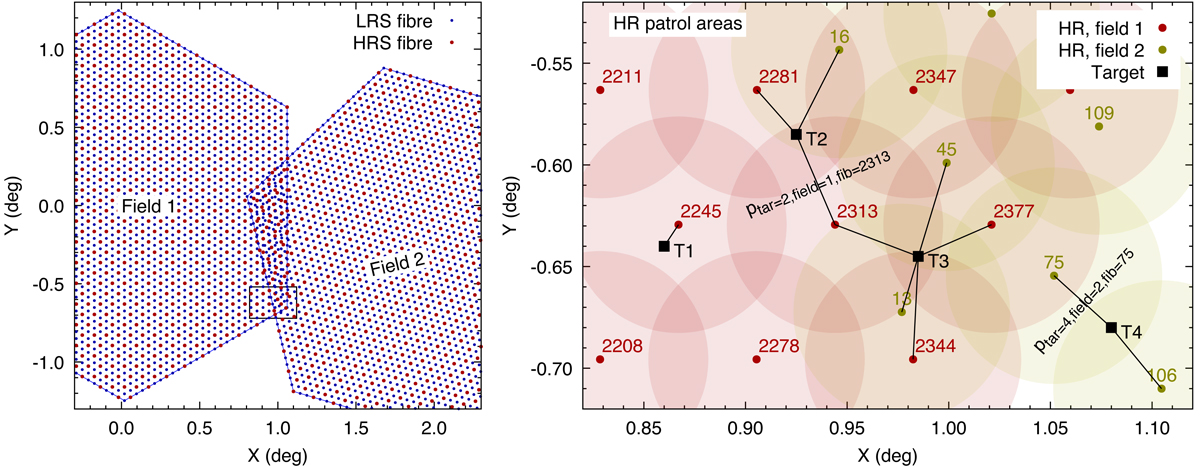
Left panel: two partially overlapping 4MOST fields with low-resolution (blue) and high-resolution (red) spectrograph fibres at their home positions. Right panel: patrol areas of high-resolution spectrograph fibres and four targets in a zoom in region highlighted in left-hand panel. Fibre home positions are marked as points and labelled with fibre numbers. Possible fibre-target pairs are illustrated with lines. Targets T2 and T3 can be reached by fibres from two fields; target T3 can be reached by three fibres from Field 1 and two fibres from Field 2; fibre 2313 can reach two targets (T2 and T3). Section 2.2 and Eq. (1) define the probability ptar, field, fib for each fibre-target pair.
Current usage metrics show cumulative count of Article Views (full-text article views including HTML views, PDF and ePub downloads, according to the available data) and Abstracts Views on Vision4Press platform.
Data correspond to usage on the plateform after 2015. The current usage metrics is available 48-96 hours after online publication and is updated daily on week days.
Initial download of the metrics may take a while.