Fig. 4.
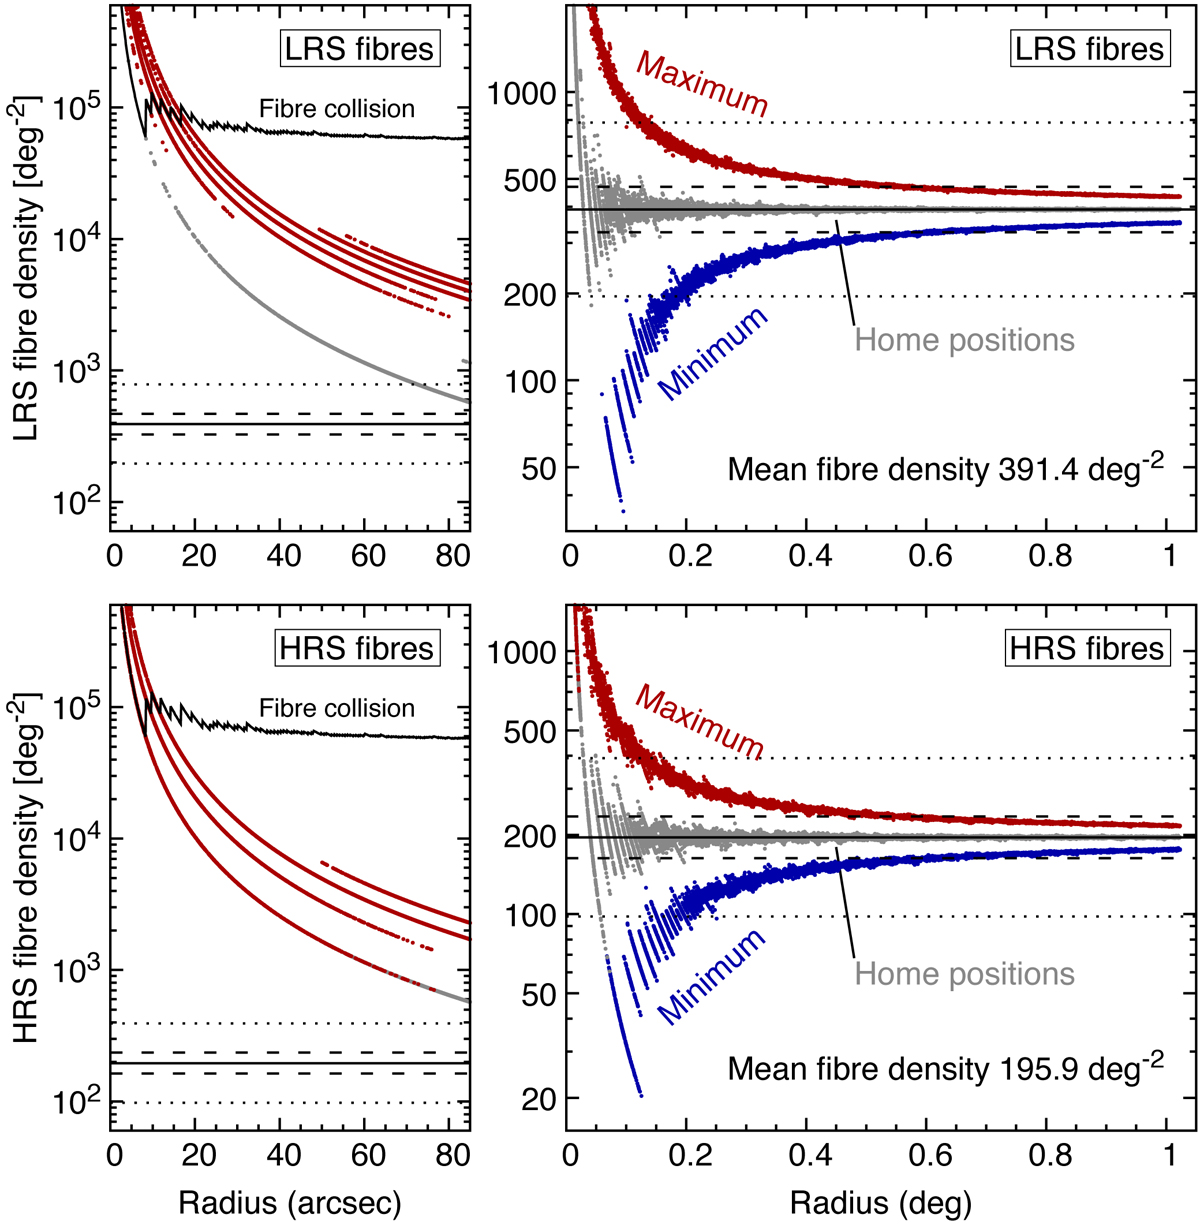
Fibre density for low-resolution (upper panel) and high-resolution (lower panel) spectrograph fibres. Right-hand panels: fibre density up to one degree, left-hand panels: fibre density at small angular scales. Fibre density is defined inside a circle (circumscribed the field of view) as a function of radius (grey points). Fibre density depends on circle location due to the fixed fibre pattern (see Fig. 1) and the scatter is higher when the radius is smaller. Red and blue points show the maximum and minimum fibre number density inside a circle, taking the fibre patrol radius into account. The solid black line shows the mean fibre density in the 4MOST field of view, which is 391.4 and 195.9 fibres per square degree for low- and high-resolution spectrograph fibres, respectively. The black dashed line shows 1.2 times higher or lower density, and the black dotted line shows two times higher or lower density compared with fibre mean density. In a circle with a radius of 0.2°, the fibre density can be twice as high or low as the mean value. In the left-hand panels, the black solid line shows fibre collision regions, where everything above the line is forbidden due to fibre collisions.
Current usage metrics show cumulative count of Article Views (full-text article views including HTML views, PDF and ePub downloads, according to the available data) and Abstracts Views on Vision4Press platform.
Data correspond to usage on the plateform after 2015. The current usage metrics is available 48-96 hours after online publication and is updated daily on week days.
Initial download of the metrics may take a while.