Fig. 5.
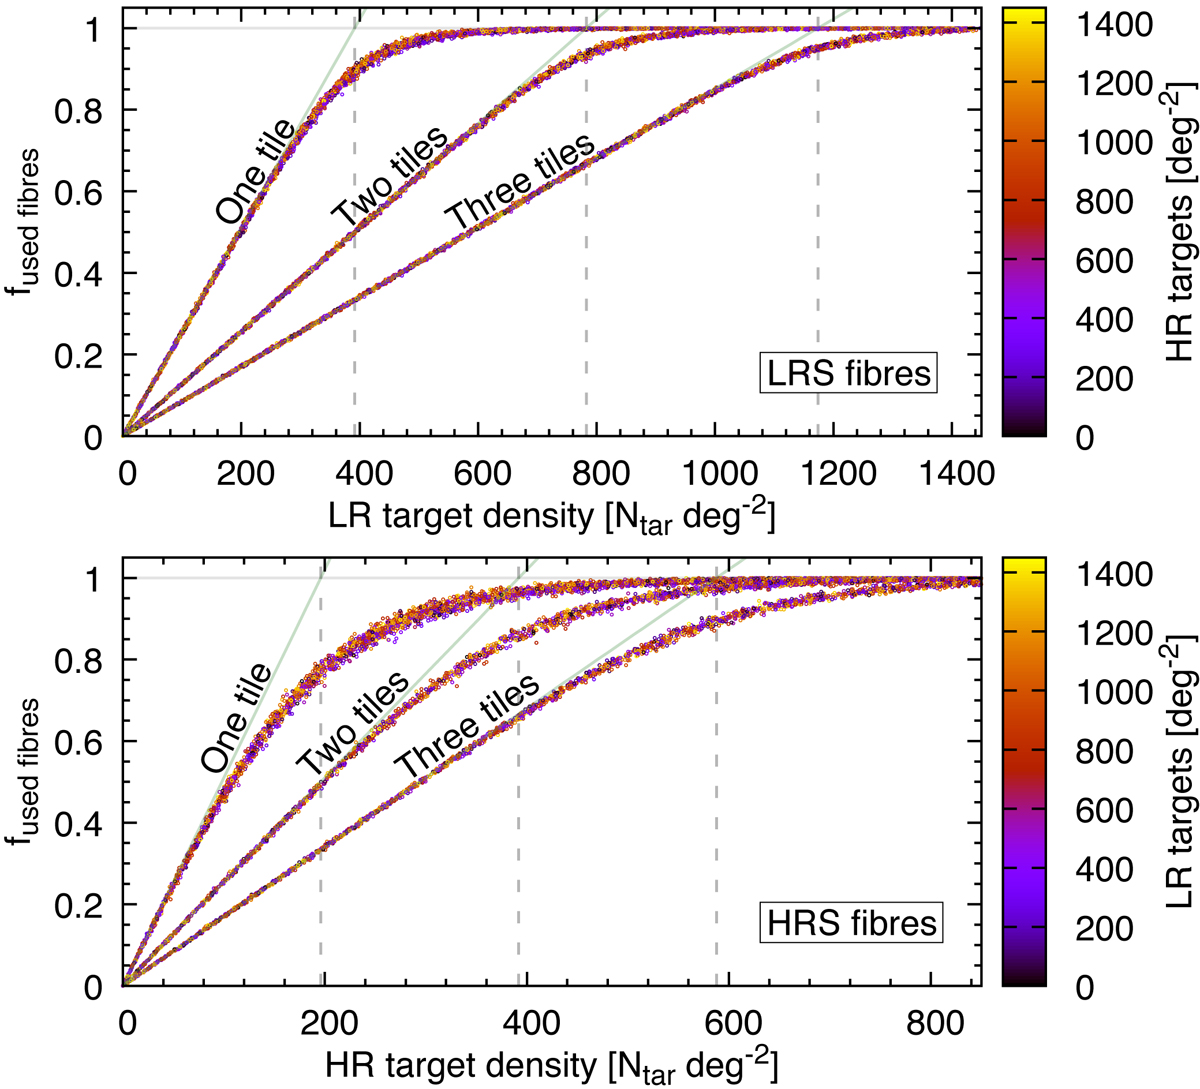
Fraction of used fibres as a function of target density, assuming a Poisson distribution of targets in the sky. Upper and lower panels: fibre usage efficiency for low- and high-resolution spectrograph fibres, respectively. Colours indicate target density for high- (upper panel) and low-resolution (lower panel) targets. The targeting simulation has been run using one, two, or three tiles (pointings) that are overlaid with small random shifts, which are indicated by three different groups of points on both panels. Each target was observed only once and all fibres were used for science targets. Solid green lines show theoretical expectations for perfect targeting. Vertical dashed lines indicate the fibre densities on the sky using one, two, or three overlapping tiles.
Current usage metrics show cumulative count of Article Views (full-text article views including HTML views, PDF and ePub downloads, according to the available data) and Abstracts Views on Vision4Press platform.
Data correspond to usage on the plateform after 2015. The current usage metrics is available 48-96 hours after online publication and is updated daily on week days.
Initial download of the metrics may take a while.