Fig. 9.
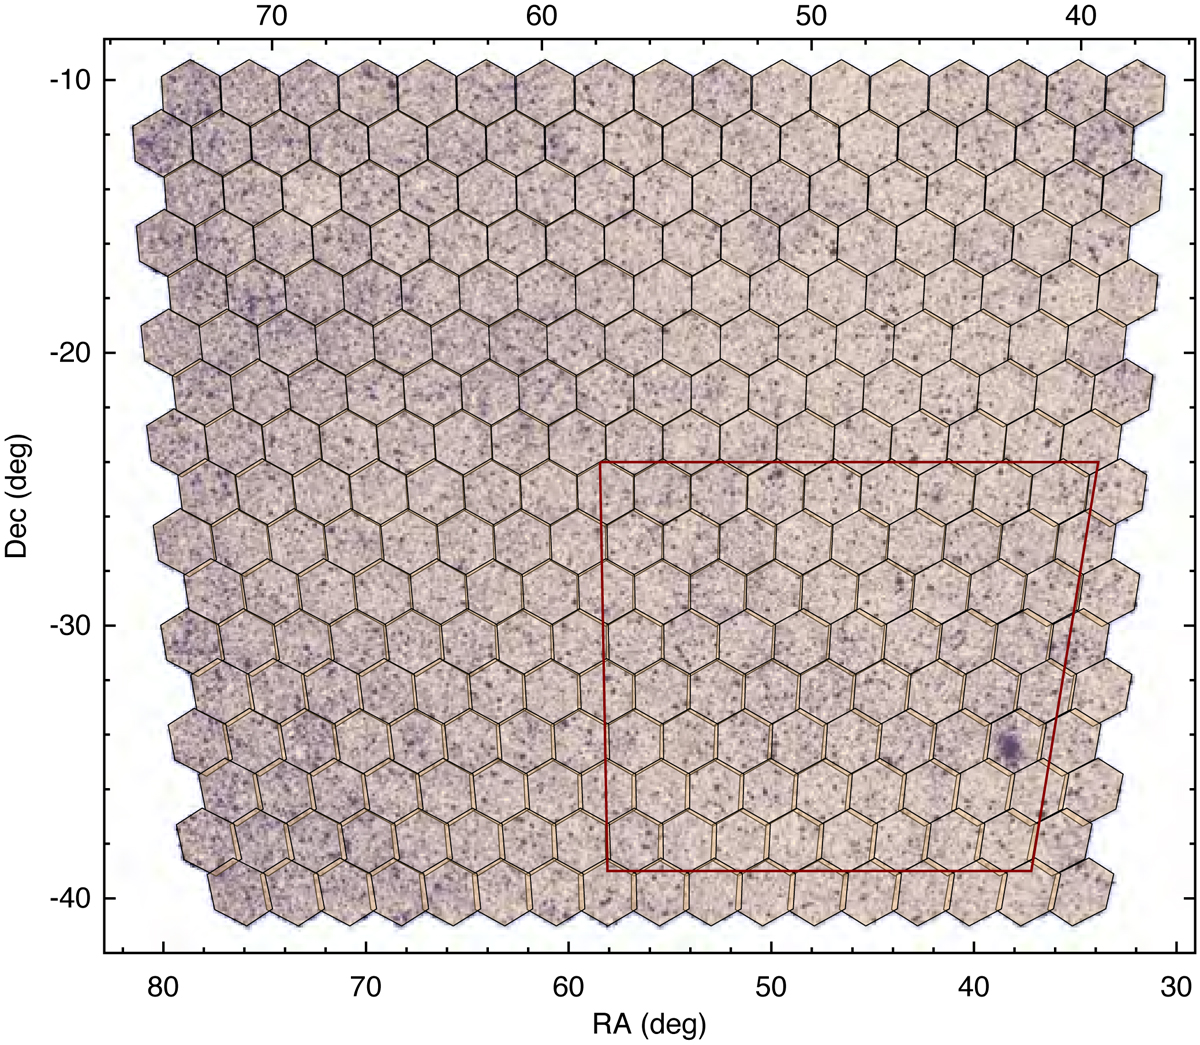
Tiling pattern across the sky area used during our tests. The underlying heat map shows the number density of targets on the sky. Darker areas show higher number density of targets. The light gradient from left to right is because of the Milky Way stellar surveys; there are more stars close to the Milky Way disc, which is located on the left side of the selected survey area. The red box highlights the smaller area that we use as a zoom region on Figs. 10, 16, and 17.
Current usage metrics show cumulative count of Article Views (full-text article views including HTML views, PDF and ePub downloads, according to the available data) and Abstracts Views on Vision4Press platform.
Data correspond to usage on the plateform after 2015. The current usage metrics is available 48-96 hours after online publication and is updated daily on week days.
Initial download of the metrics may take a while.