Fig. 1.
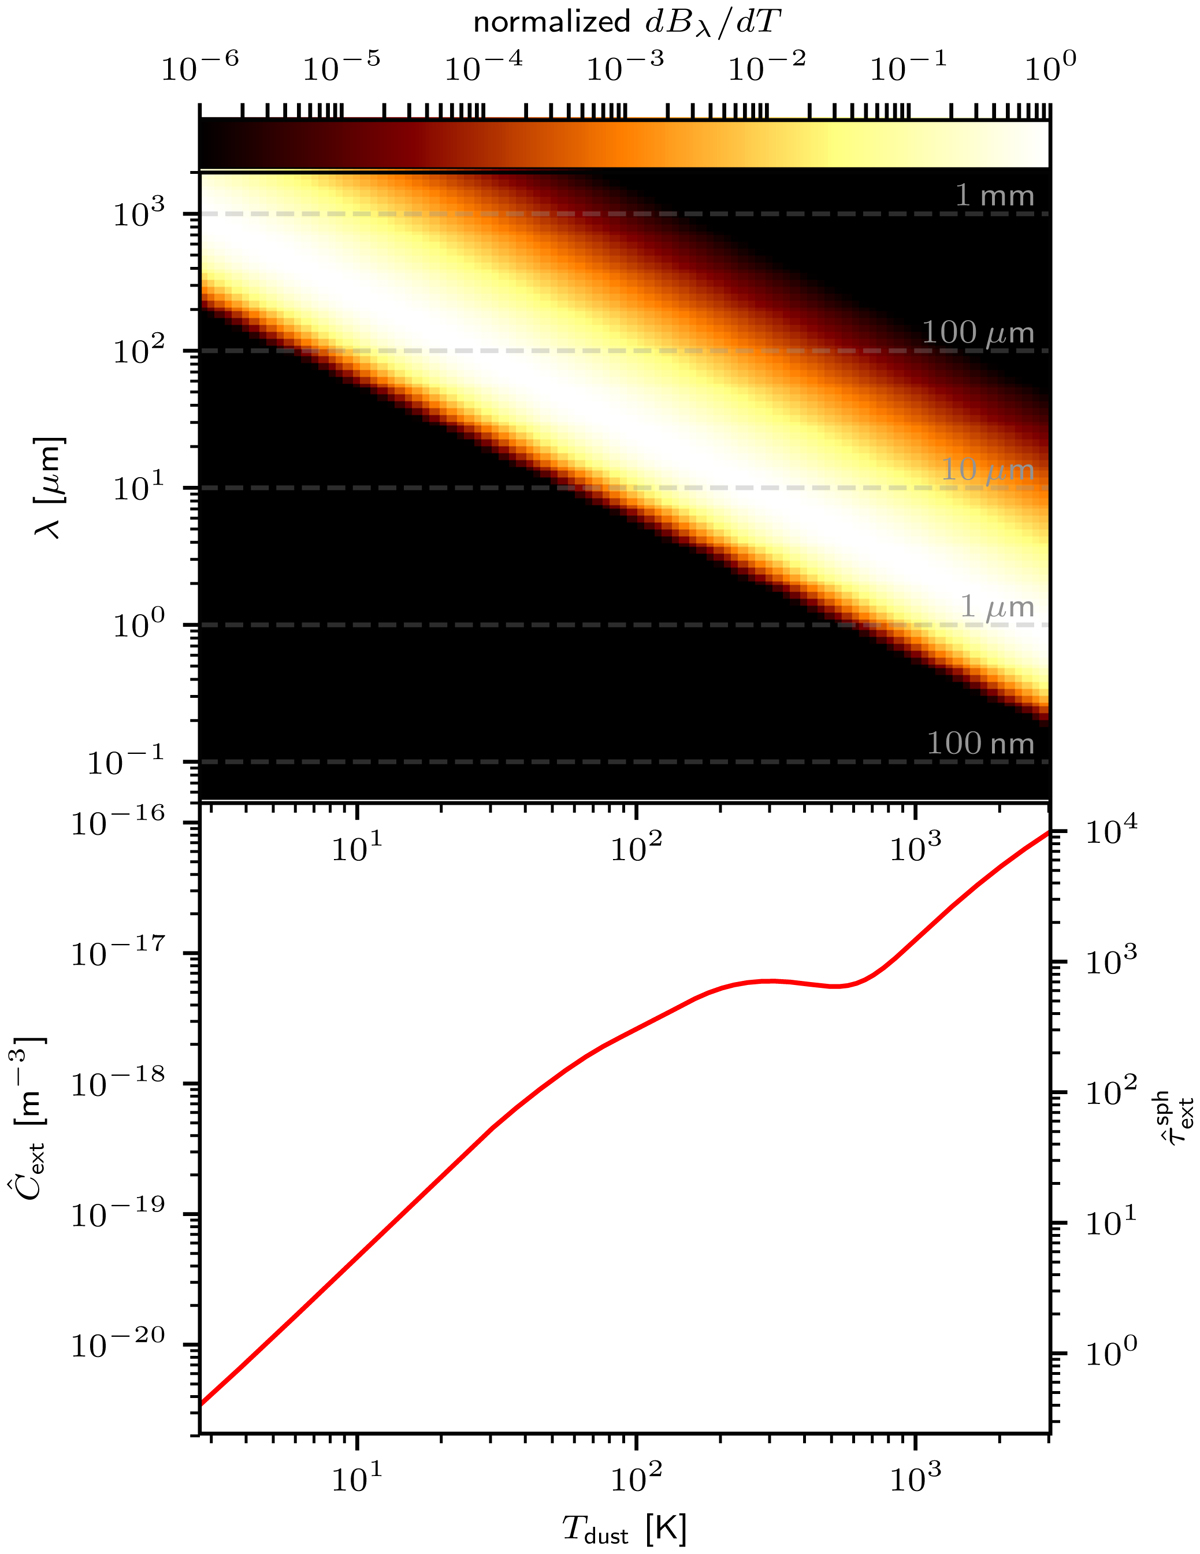
Visualization of the temperature dependence of reemitted photon packages when using the (difference) spectrum dBλ/dT. Top: difference spectrum dBλ/dT that is normalized for each temperature value Tdust to a maximum value of 1 is displayed. Bottom: effective extinction cross-section Ĉext (see Eq. (4); left axis) and the optical depth ![]() (see Eq. (3); right axis) as a function of the dust temperature Tdust. For details, see Sect. 2.2.
(see Eq. (3); right axis) as a function of the dust temperature Tdust. For details, see Sect. 2.2.
Current usage metrics show cumulative count of Article Views (full-text article views including HTML views, PDF and ePub downloads, according to the available data) and Abstracts Views on Vision4Press platform.
Data correspond to usage on the plateform after 2015. The current usage metrics is available 48-96 hours after online publication and is updated daily on week days.
Initial download of the metrics may take a while.