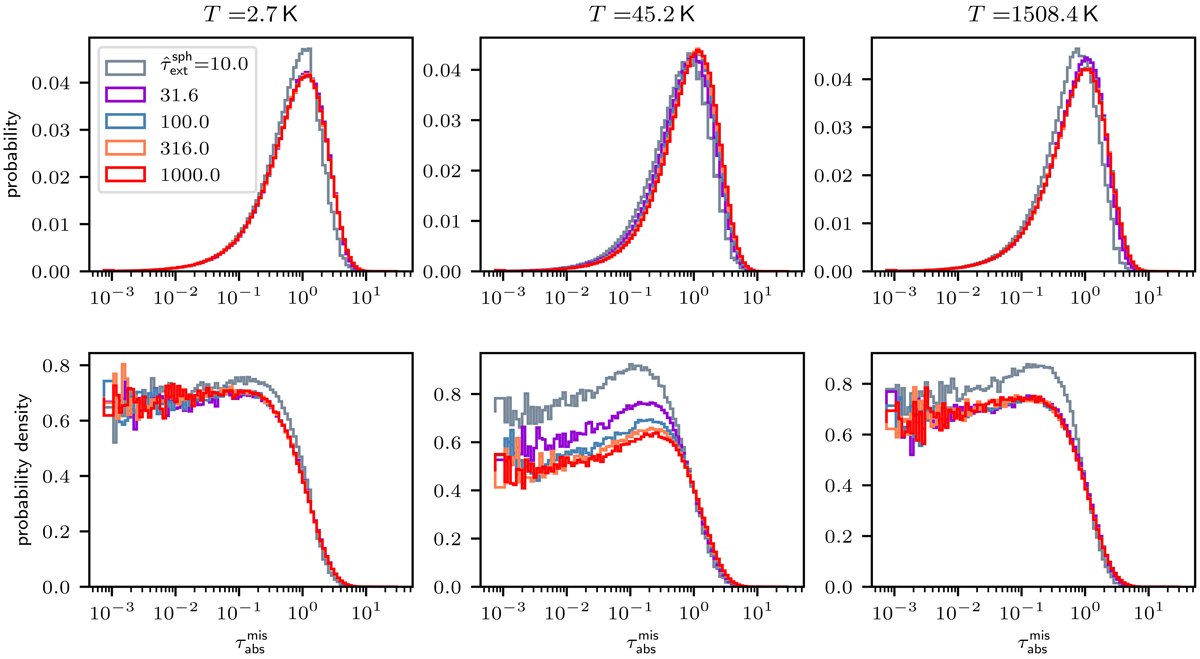
Fig. 2.
Result for the distribution ![]() using 106 simulations per temperature and a value of
using 106 simulations per temperature and a value of ![]() . Three different temperatures 2.73 K, 45 K, and 1508 K are displayed in the first, second, and third columns, respectively; the probability is shown in the first row and the probability density is illustrated in the second row. Different sphere sizes
. Three different temperatures 2.73 K, 45 K, and 1508 K are displayed in the first, second, and third columns, respectively; the probability is shown in the first row and the probability density is illustrated in the second row. Different sphere sizes ![]() exhibit notable similarities with regard to the shape and average value of their corresponding
exhibit notable similarities with regard to the shape and average value of their corresponding ![]() distributions. This shows that radiation, which is emitted by dense spheres of different sizes but with identical temperatures, thus, originates from a similar distance from the rim of each sphere.
distributions. This shows that radiation, which is emitted by dense spheres of different sizes but with identical temperatures, thus, originates from a similar distance from the rim of each sphere.
Current usage metrics show cumulative count of Article Views (full-text article views including HTML views, PDF and ePub downloads, according to the available data) and Abstracts Views on Vision4Press platform.
Data correspond to usage on the plateform after 2015. The current usage metrics is available 48-96 hours after online publication and is updated daily on week days.
Initial download of the metrics may take a while.