Fig. 2
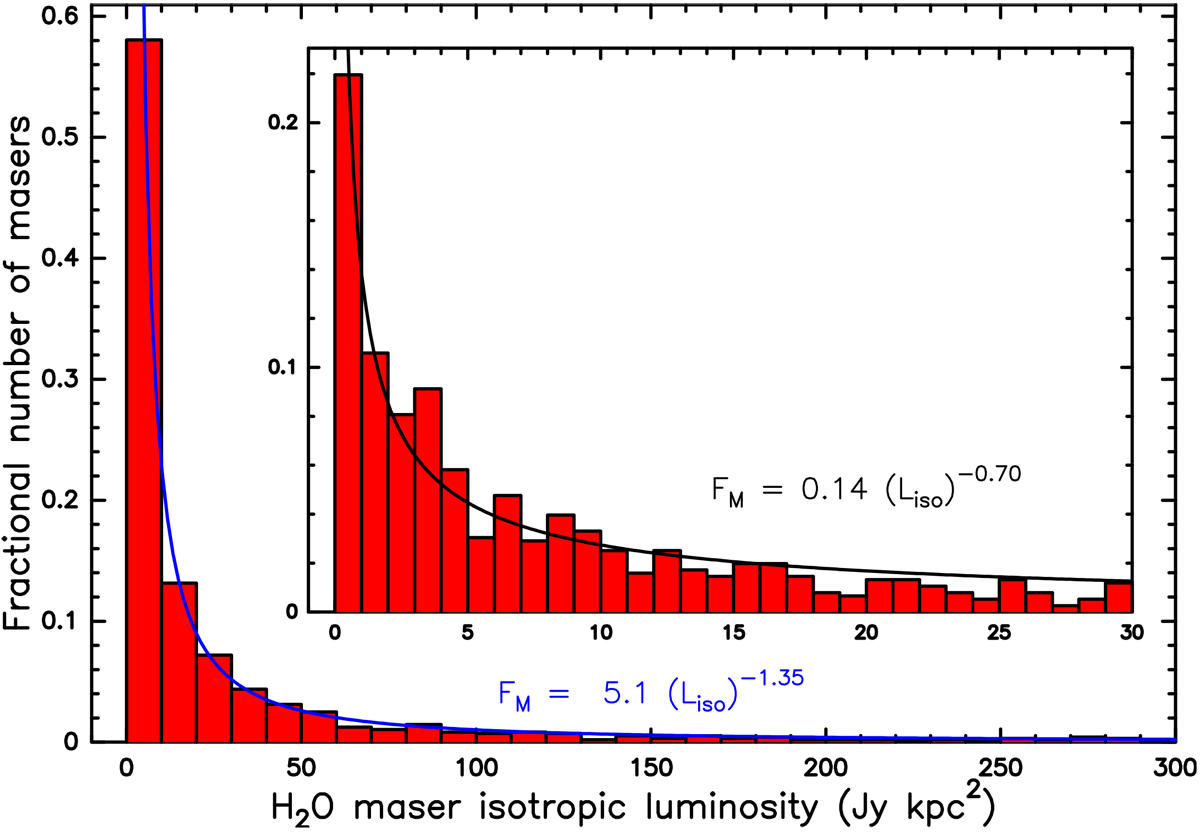
Histograms of the maser isotropic luminosity for a maximum maser luminosity of 300 Jy kpc2 (main) and 30 Jy kpc2 (inset). Less than 4% of the observed masers have an isotropic luminosity higher than 300 Jy kpc2. The bins are 10 and 1 Jy kpc2 for the histograms in the main plot and in the inset, respectively. The histogram values are normalized by the total number of selected water masers. The continuous blue and black lines show the power-law fits of the values of the histograms in the main plot and in the inset, respectively, and the best-fit expressions are also reported using the same colors of thecorresponding fits.
Current usage metrics show cumulative count of Article Views (full-text article views including HTML views, PDF and ePub downloads, according to the available data) and Abstracts Views on Vision4Press platform.
Data correspond to usage on the plateform after 2015. The current usage metrics is available 48-96 hours after online publication and is updated daily on week days.
Initial download of the metrics may take a while.