Fig. 4
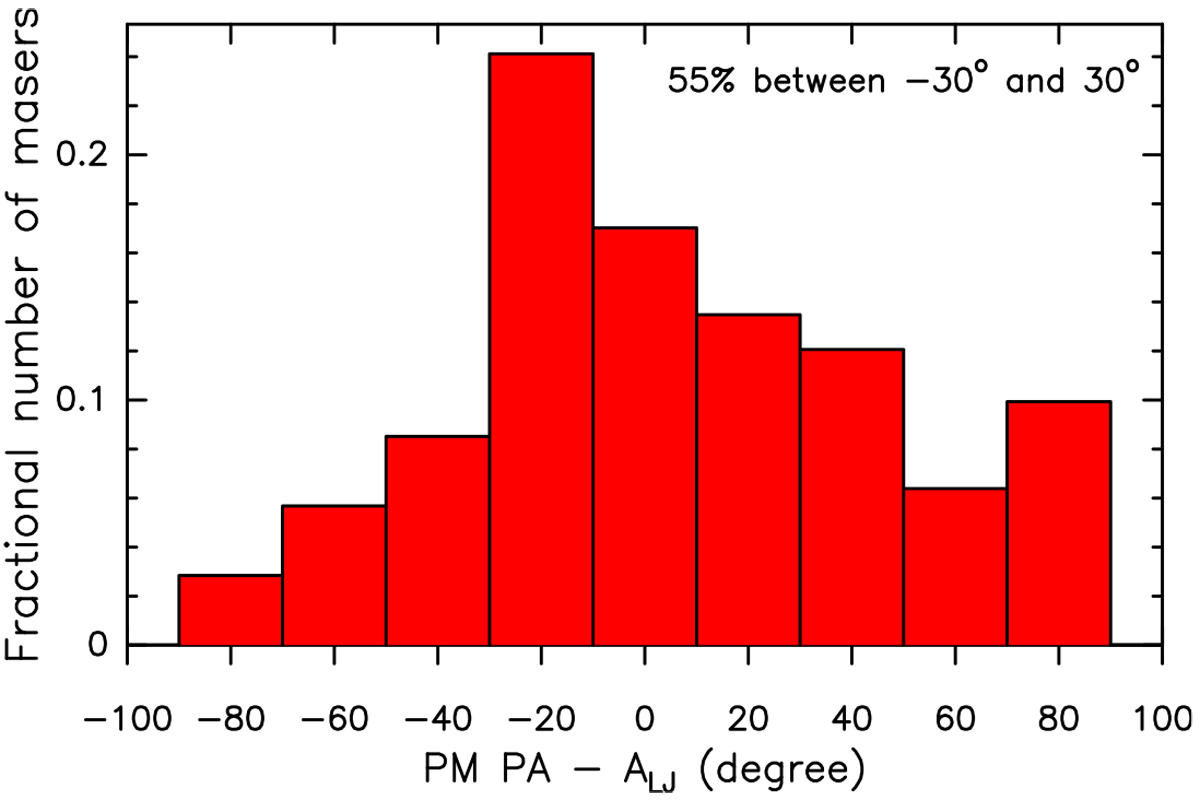
Histogram of the difference between the maser PM PA and the PA of the jet axis from the literature, ALJ, cumulating all the 14 POETS targets in which a jet has been observed throughthermal tracers (see Table A.1 of Paper III). The histogram bin is 20° and the histogram values are normalized by the total number of considered PMs. The target-average error on the PM PA and corresponding standard deviation are 12° and 4°.
Current usage metrics show cumulative count of Article Views (full-text article views including HTML views, PDF and ePub downloads, according to the available data) and Abstracts Views on Vision4Press platform.
Data correspond to usage on the plateform after 2015. The current usage metrics is available 48-96 hours after online publication and is updated daily on week days.
Initial download of the metrics may take a while.