Fig. 4
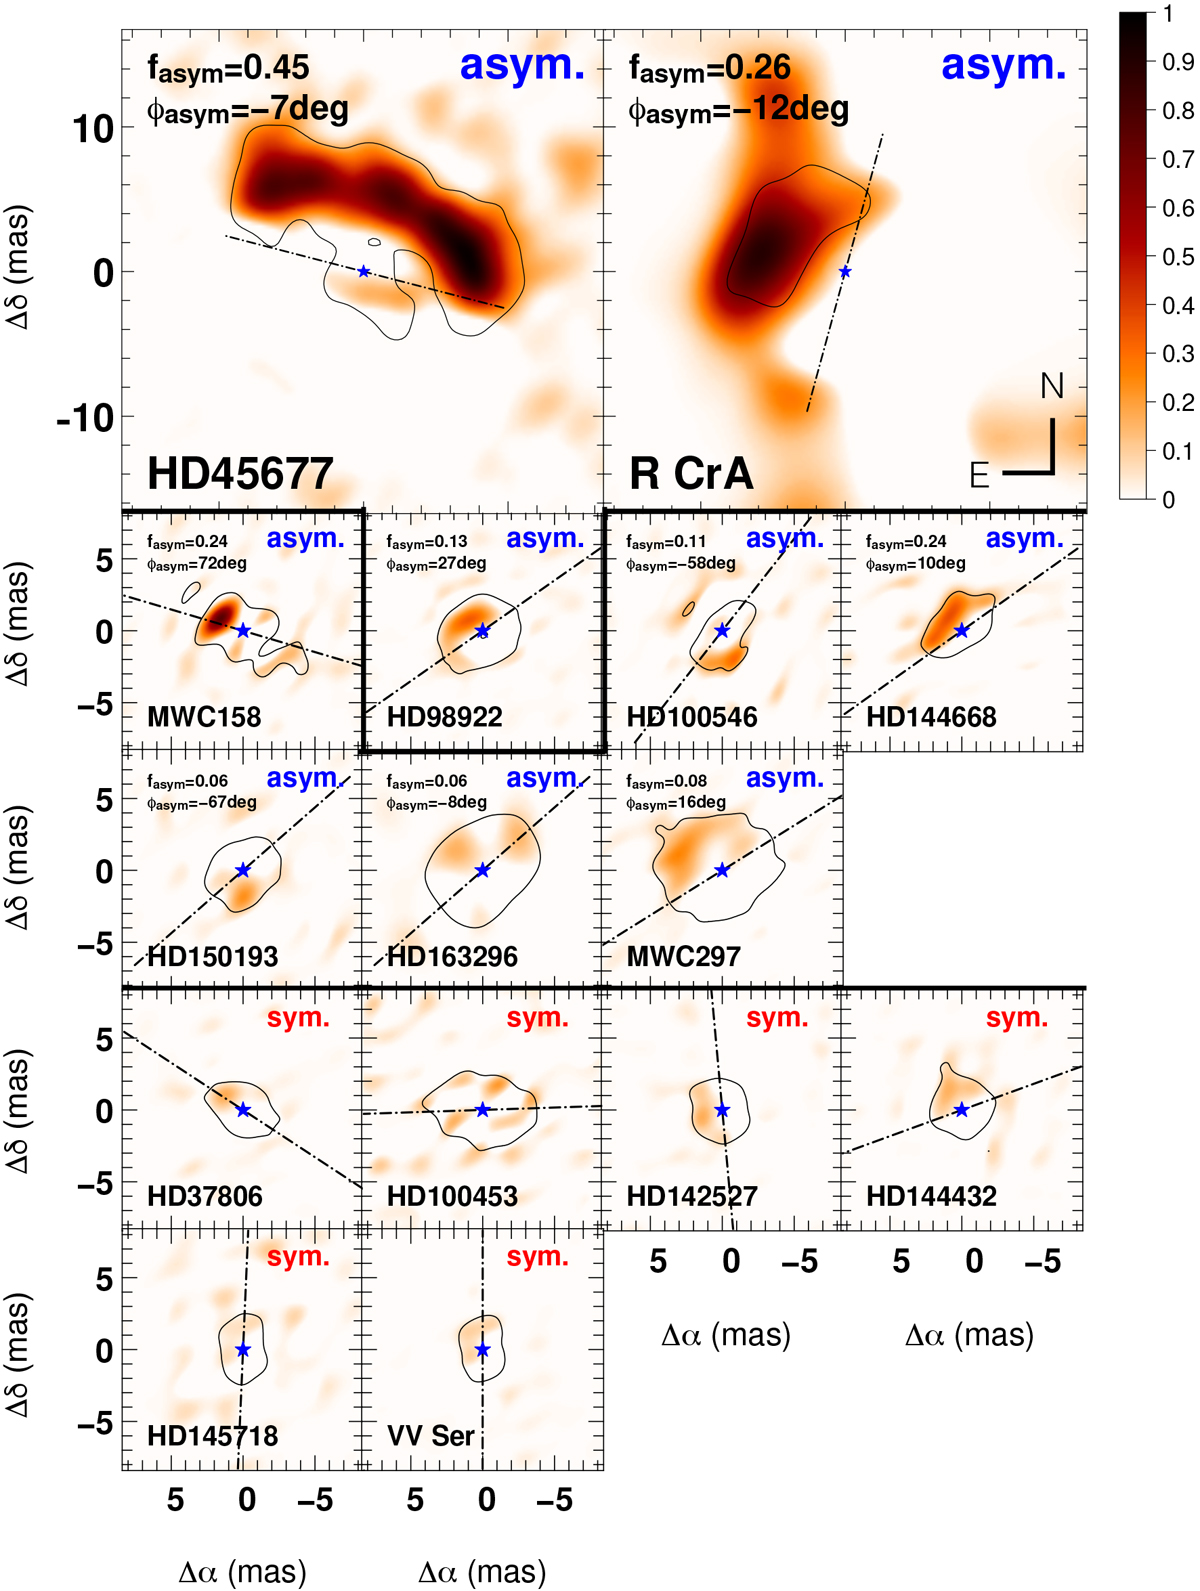
Asymmetry maps of the targets classified the same way as in Fig. 2. The blue star represents the central star, the solid black contour represents the 3σ significance profile, and the dot-dashed line represents the orientation of the major-axis from parametric fitting. The targets with three closure phase points or more with a significance of 5σ are indicated as “asym”.
Current usage metrics show cumulative count of Article Views (full-text article views including HTML views, PDF and ePub downloads, according to the available data) and Abstracts Views on Vision4Press platform.
Data correspond to usage on the plateform after 2015. The current usage metrics is available 48-96 hours after online publication and is updated daily on week days.
Initial download of the metrics may take a while.