Fig. 6
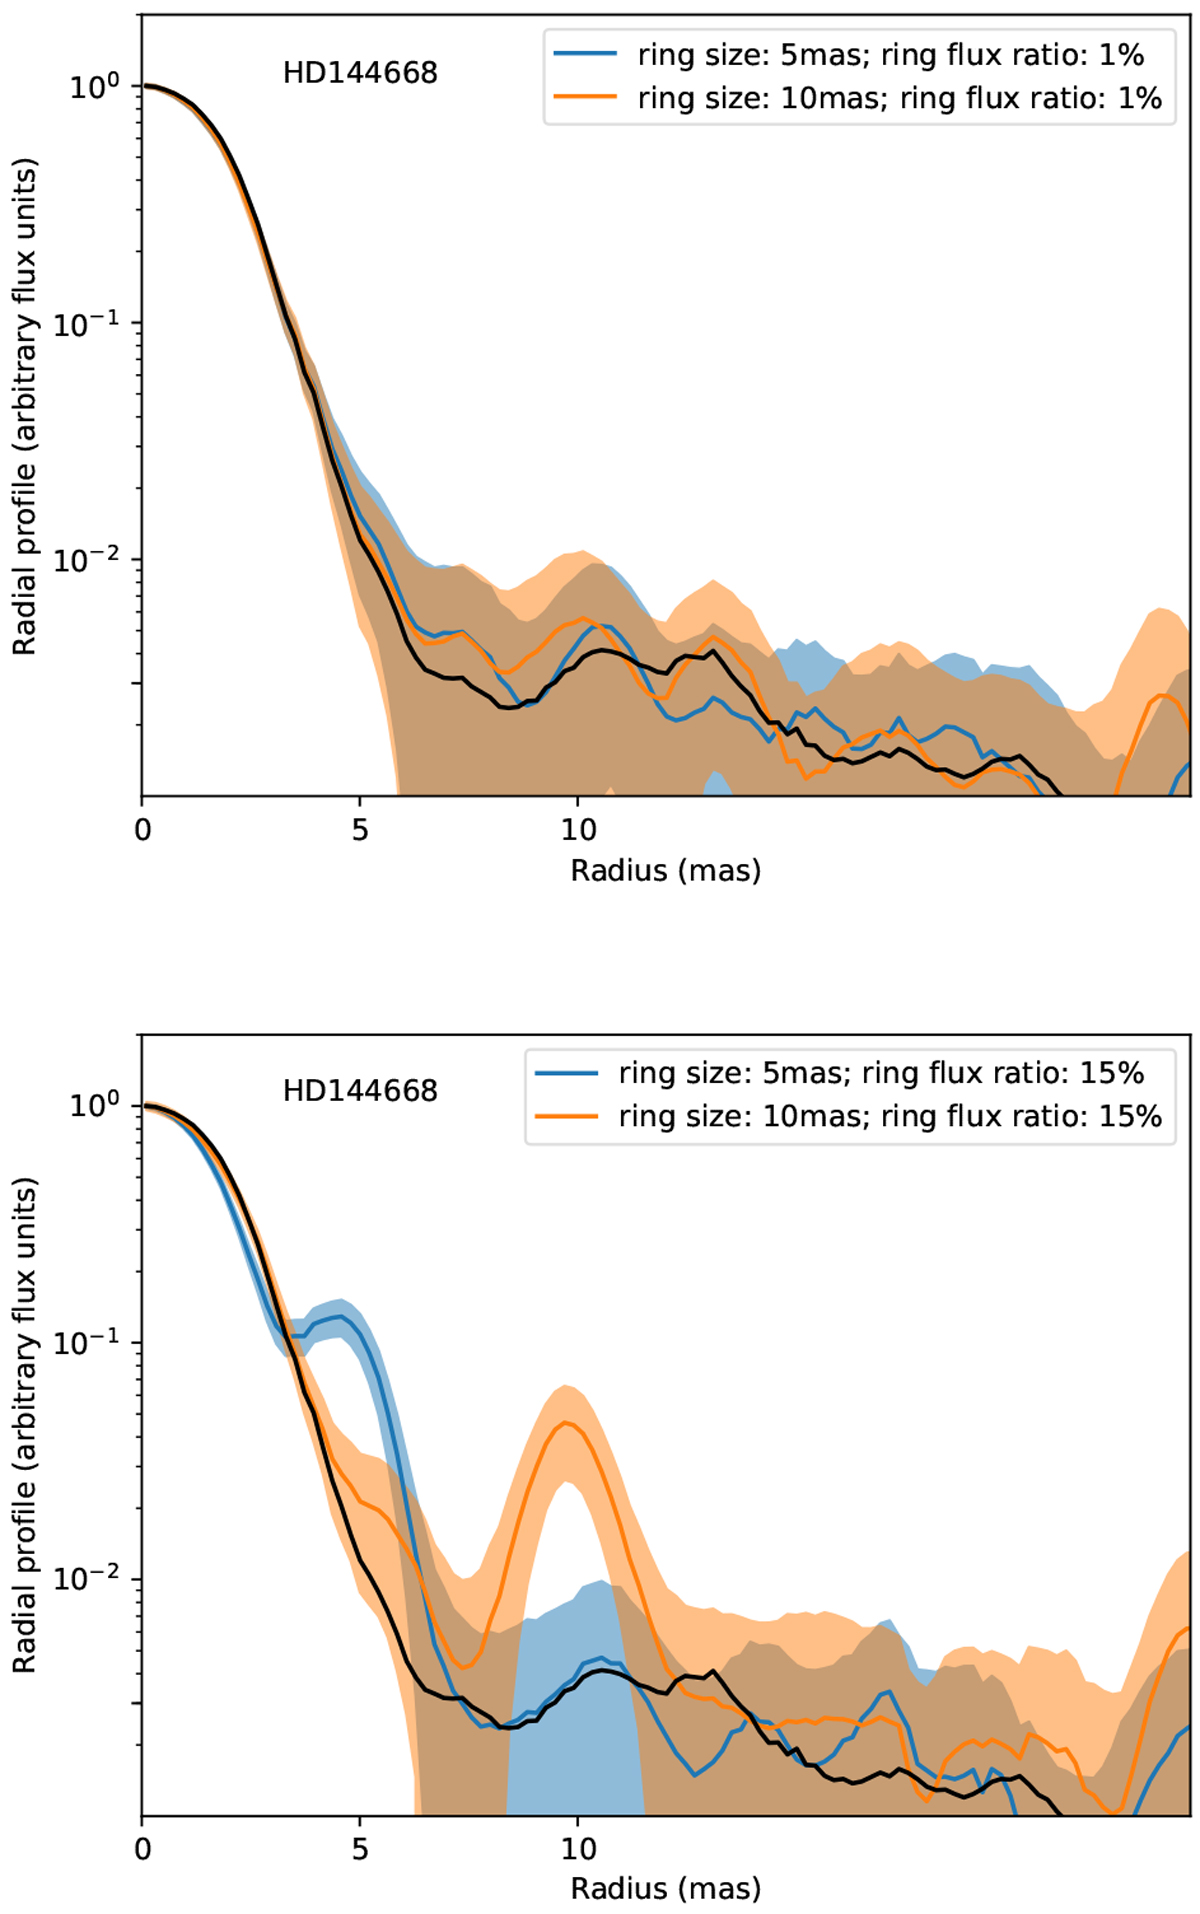
Radial profiles of reconstructed images on synthetic data where a ring has been added. The black curves show the radial profiles in the images restored from the original data. The blue and orange curves show the radial profiles in the restoredimages with an additional ring of radius 5 and 10 mas, respectively. The shaded areas show the limits at ±1 standard deviation of the profiles (of the same color). The standard deviation of the profile from theoriginal data is not shown. Top: the ring has a flux of 1% of the total flux at 1.65 μm. Bottom: the ring has a flux of 15% of the total flux at 1.65 μm.
Current usage metrics show cumulative count of Article Views (full-text article views including HTML views, PDF and ePub downloads, according to the available data) and Abstracts Views on Vision4Press platform.
Data correspond to usage on the plateform after 2015. The current usage metrics is available 48-96 hours after online publication and is updated daily on week days.
Initial download of the metrics may take a while.