Fig. 5.
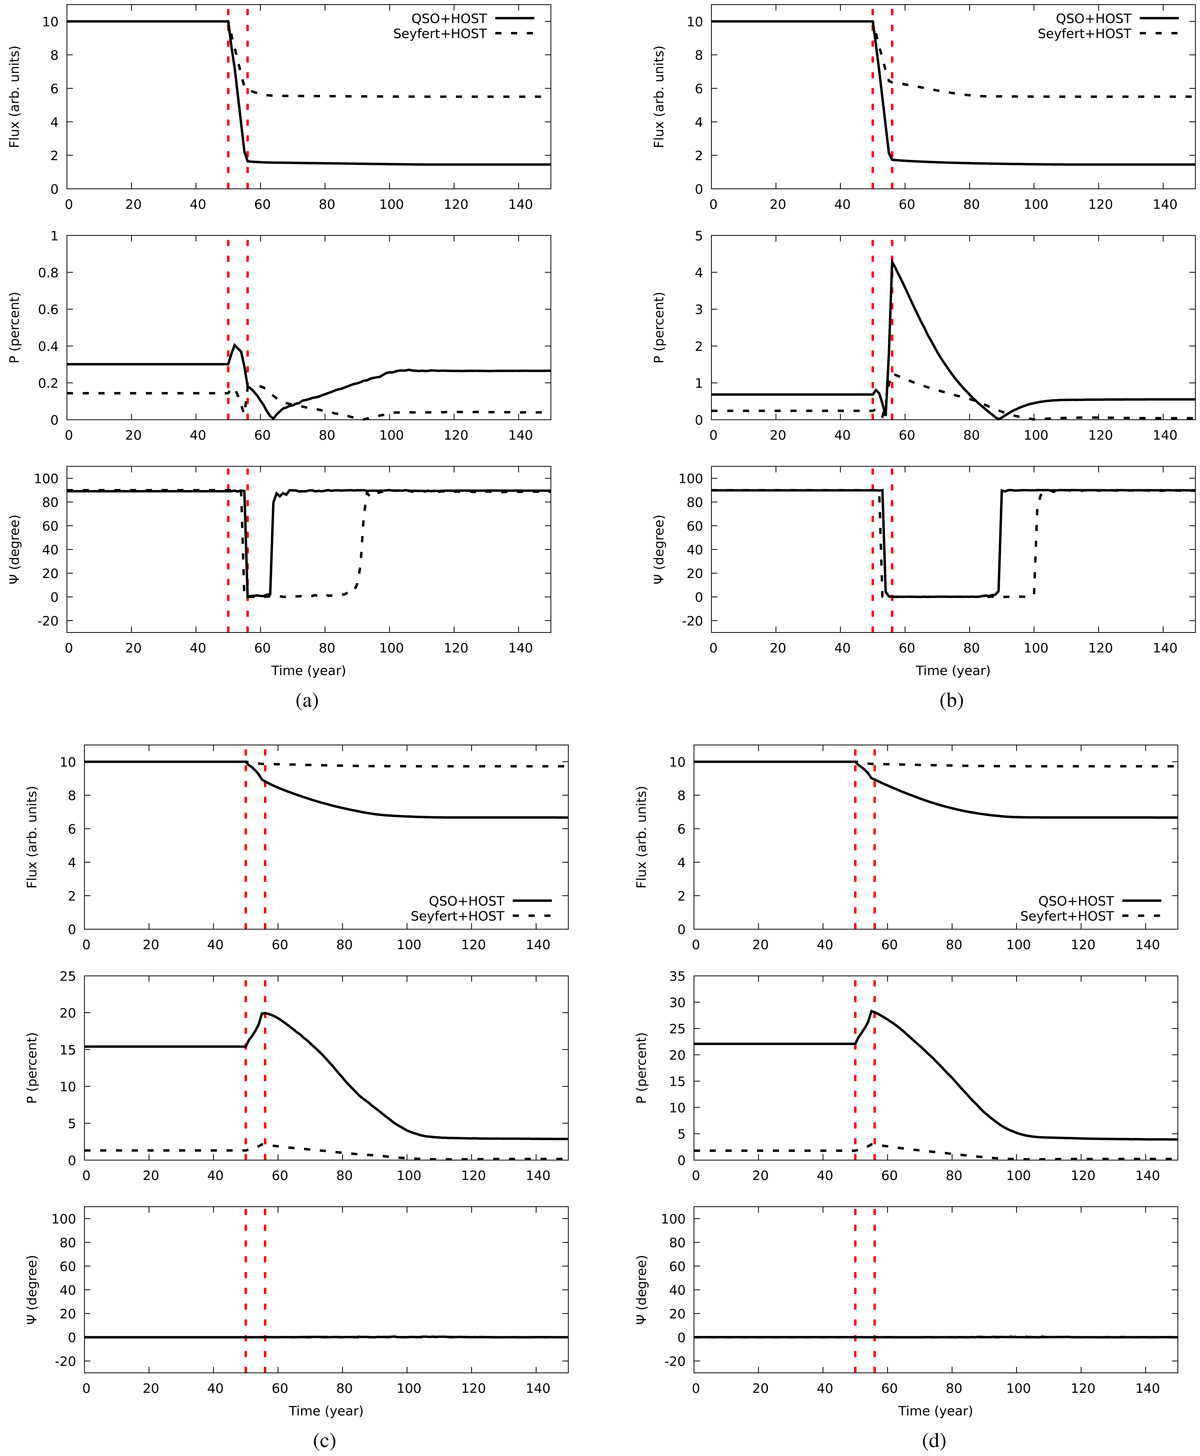
Comparison between the polarization time series of changing-look quasars (solid line) and Seyfert galaxies (dashed lines). Only the relative contribution of the host galaxy to the total and polarized type 1 fluxes is different: 5% in the quasar case, and 50% for Seyfert galaxies. The rest of the panel description is similar to the caption of Fig. 3. a: observer inclination ∼10° from the polar axis of the model. b: observer inclination ∼45° from the polar axis of the model. c: observer inclination ∼60° from the polar axis of the model. d: observer inclination ∼80° from the polar axis of the model.
Current usage metrics show cumulative count of Article Views (full-text article views including HTML views, PDF and ePub downloads, according to the available data) and Abstracts Views on Vision4Press platform.
Data correspond to usage on the plateform after 2015. The current usage metrics is available 48-96 hours after online publication and is updated daily on week days.
Initial download of the metrics may take a while.