Fig. 10.
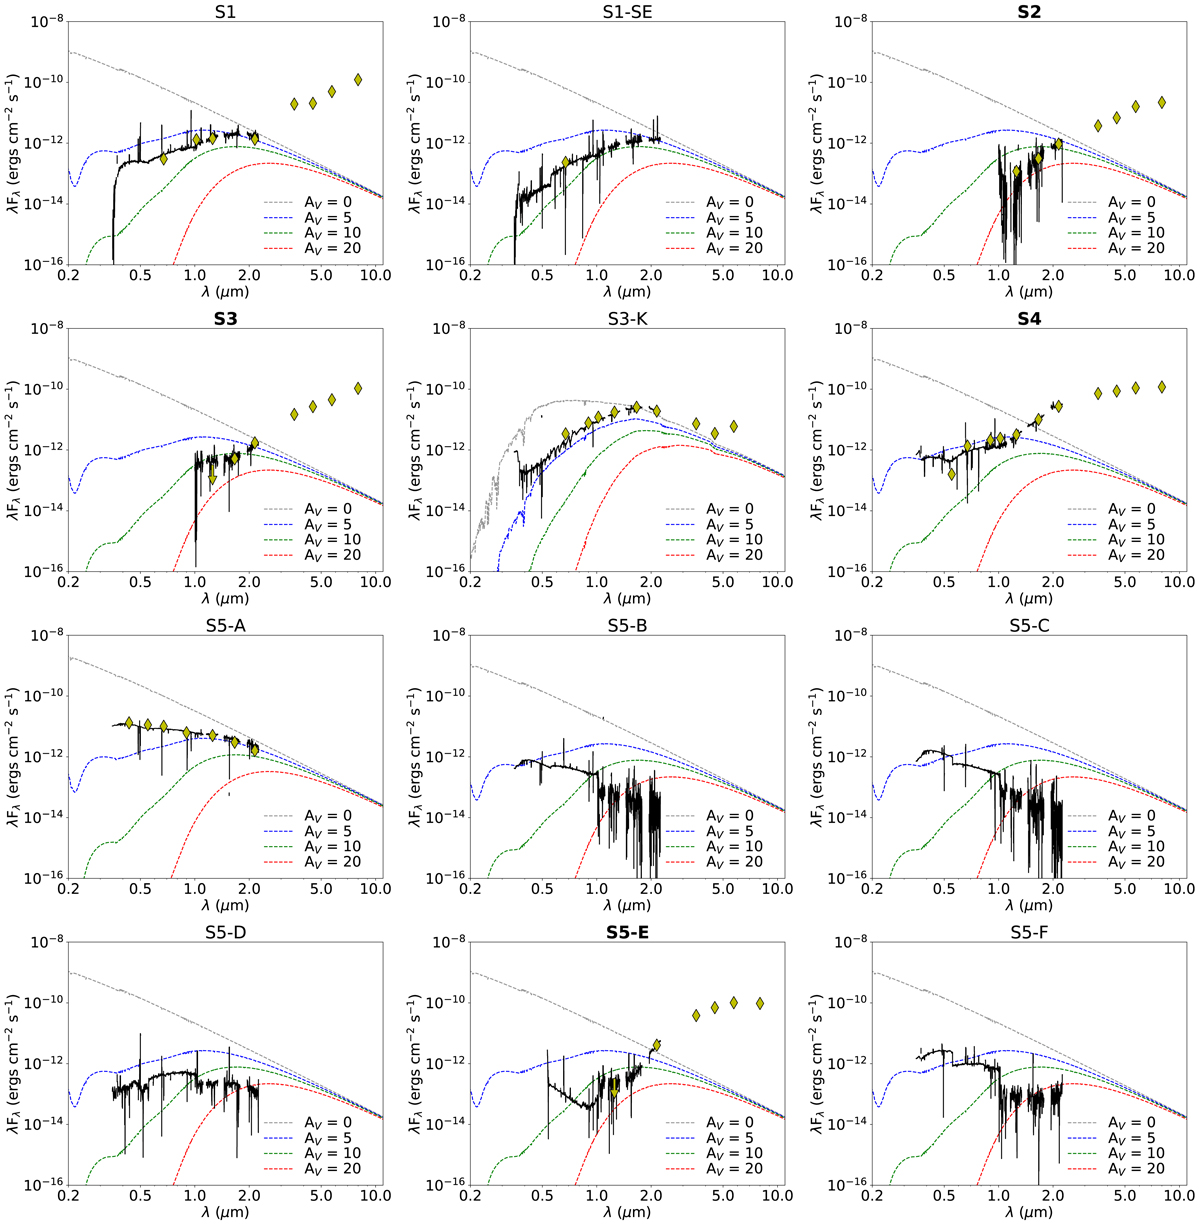
SEDs of S1–S5-F. The spectrum of each object is shown in black and has been smoothed by a factor of 100. The confirmed MYSOs are indicated in bold. The objects S5-B, S5-C, S5-D, and S5-F were not corrected for slit loss since we lack photometry of these objects. The telluric absorption bands around 1.1 μm, 1.5 μm, and 2.0 μm are clipped. Additionally, we clipped the spectrum above 2.25 μm due to sky variations and at short wavelengths for S2, S3, and S5-E due to the low flux of these objects. Literature photometric points are shown as the yellow diamonds (Parker 1992; Cutri et al. 2003; Kato et al. 2007; Walborn et al. 2013; Gaia Collaboration 2016). Upper limits are indicated with an arrow. With the dashed lines, we plotted a Castelli & Kurucz model for various AV.
Current usage metrics show cumulative count of Article Views (full-text article views including HTML views, PDF and ePub downloads, according to the available data) and Abstracts Views on Vision4Press platform.
Data correspond to usage on the plateform after 2015. The current usage metrics is available 48-96 hours after online publication and is updated daily on week days.
Initial download of the metrics may take a while.