Fig. 12.
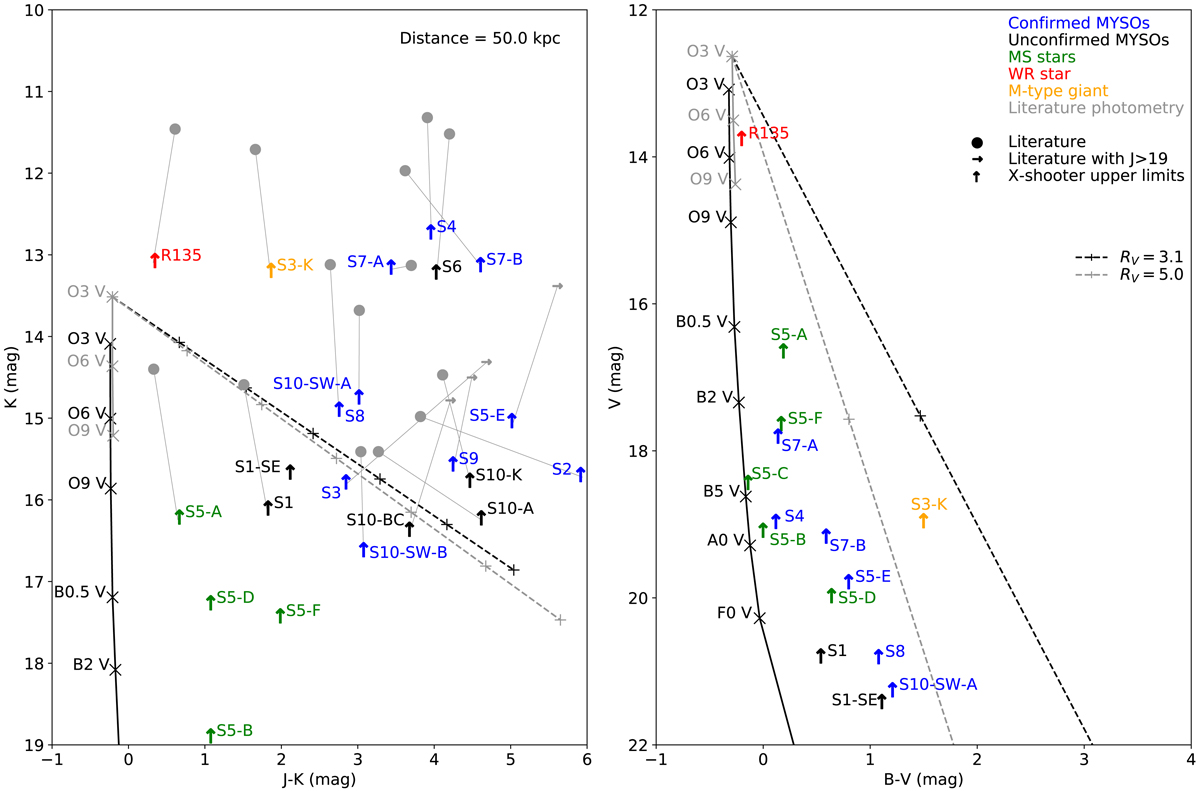
Left: NIR color-magnitude diagram of the upper limits derived from our X-shooter spectra (see Appendix C). Error bars are omitted for clarity, but they may be found in Appendix C; the typical error is ∼0.6 mag. The gray lines link our upper limit with the literature values (gray dots and arrows). All of the other lines are the same as in Fig. 2. We note that the color is composed of a subtraction of two upper limits and, therefore, it is uncertain. Right: optical color-magnitude diagram of the upper limit photometric points. In the VIS range, the photometric upper limits are well below the reddening line. Again the color is composed of a subtraction of two upper limits and, therefore, it is uncertain.
Current usage metrics show cumulative count of Article Views (full-text article views including HTML views, PDF and ePub downloads, according to the available data) and Abstracts Views on Vision4Press platform.
Data correspond to usage on the plateform after 2015. The current usage metrics is available 48-96 hours after online publication and is updated daily on week days.
Initial download of the metrics may take a while.