Fig. 3.
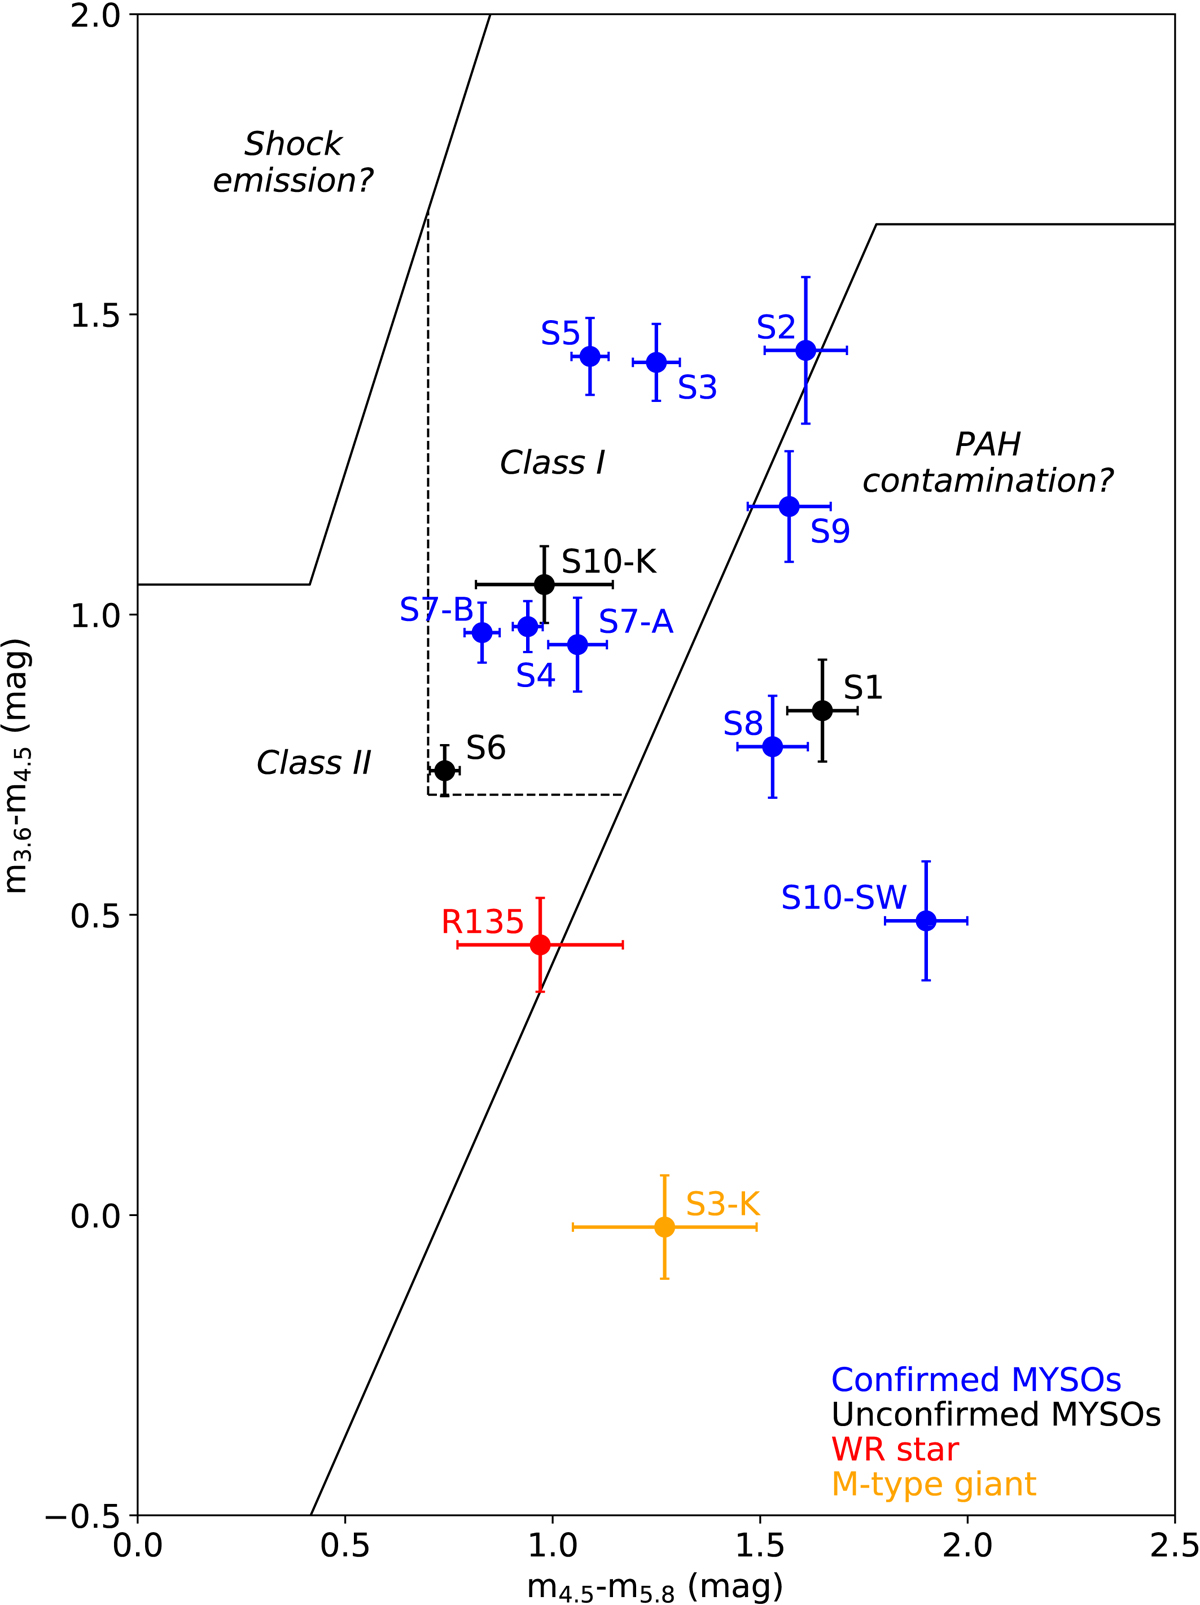
MIR color-color diagram showing the Spitzer/IRAC colors of our confirmed MYSOs (blue dots) and the unconfirmed MYSO candidates (black dots). The Spitzer/IRAC photometric points of the MYSO candidates and S3-K are from Walborn et al. (2013). The photometric points of R135 are from the Spitzer/SAGE catalog (Meixner et al. 2006). Following the classification scheme of Gutermuth et al. (2009), we indicate the Class I and Class II regions and the regions where the Spitzer/IRAC colors might include unresolved knots of shock emission or resolved structured PAH emission.
Current usage metrics show cumulative count of Article Views (full-text article views including HTML views, PDF and ePub downloads, according to the available data) and Abstracts Views on Vision4Press platform.
Data correspond to usage on the plateform after 2015. The current usage metrics is available 48-96 hours after online publication and is updated daily on week days.
Initial download of the metrics may take a while.