Fig. 4.
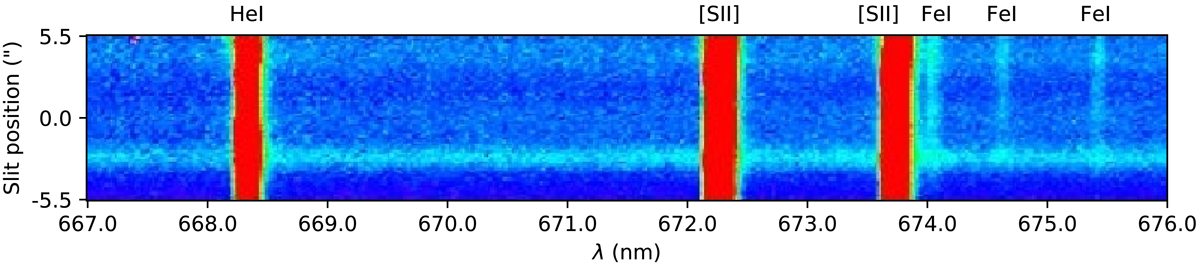
Reduced 2D science frame of S4 as assessed from the pipeline. We show a single nodding position. The color indicates flux, where red and blue are high and low flux, respectively. The spatial position is with respect to the center of the slit. The figure is centered around the [S II] 671.6,673.1 nm lines (the two bright lines on the right) and the He I 667.8 nm line (the bright line on the left), all originating from the nebula. The three weak lines on the right are nebular Fe I lines. The continuum of S4 is visible in the lower part of the 2D frame. Additionally, some nebular continuum is visible. At the top, some weak continuum from an object not analyzed in this work.
Current usage metrics show cumulative count of Article Views (full-text article views including HTML views, PDF and ePub downloads, according to the available data) and Abstracts Views on Vision4Press platform.
Data correspond to usage on the plateform after 2015. The current usage metrics is available 48-96 hours after online publication and is updated daily on week days.
Initial download of the metrics may take a while.