Free Access
Fig. 6.
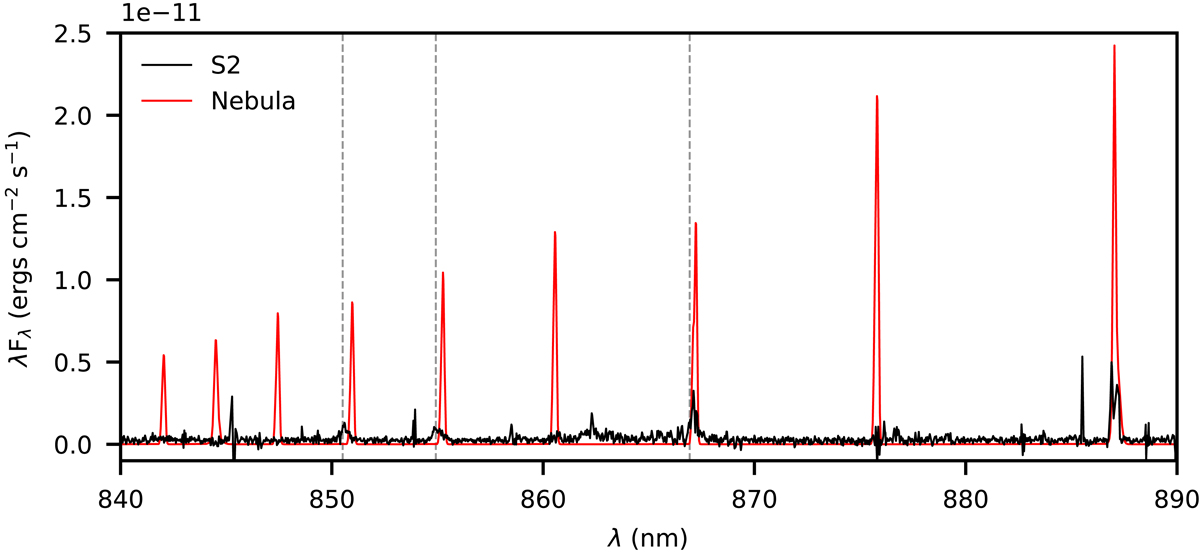
Nebular and sky subtracted spectrum of S2 (black) and subtracted nebular contribution (red) centered around the Ca II IRT lines (indicated with vertical gray dashed lines). The nebular lines are Pa-11–19. Some residuals persist after the nebular subtraction.
Current usage metrics show cumulative count of Article Views (full-text article views including HTML views, PDF and ePub downloads, according to the available data) and Abstracts Views on Vision4Press platform.
Data correspond to usage on the plateform after 2015. The current usage metrics is available 48-96 hours after online publication and is updated daily on week days.
Initial download of the metrics may take a while.