Fig. 7.
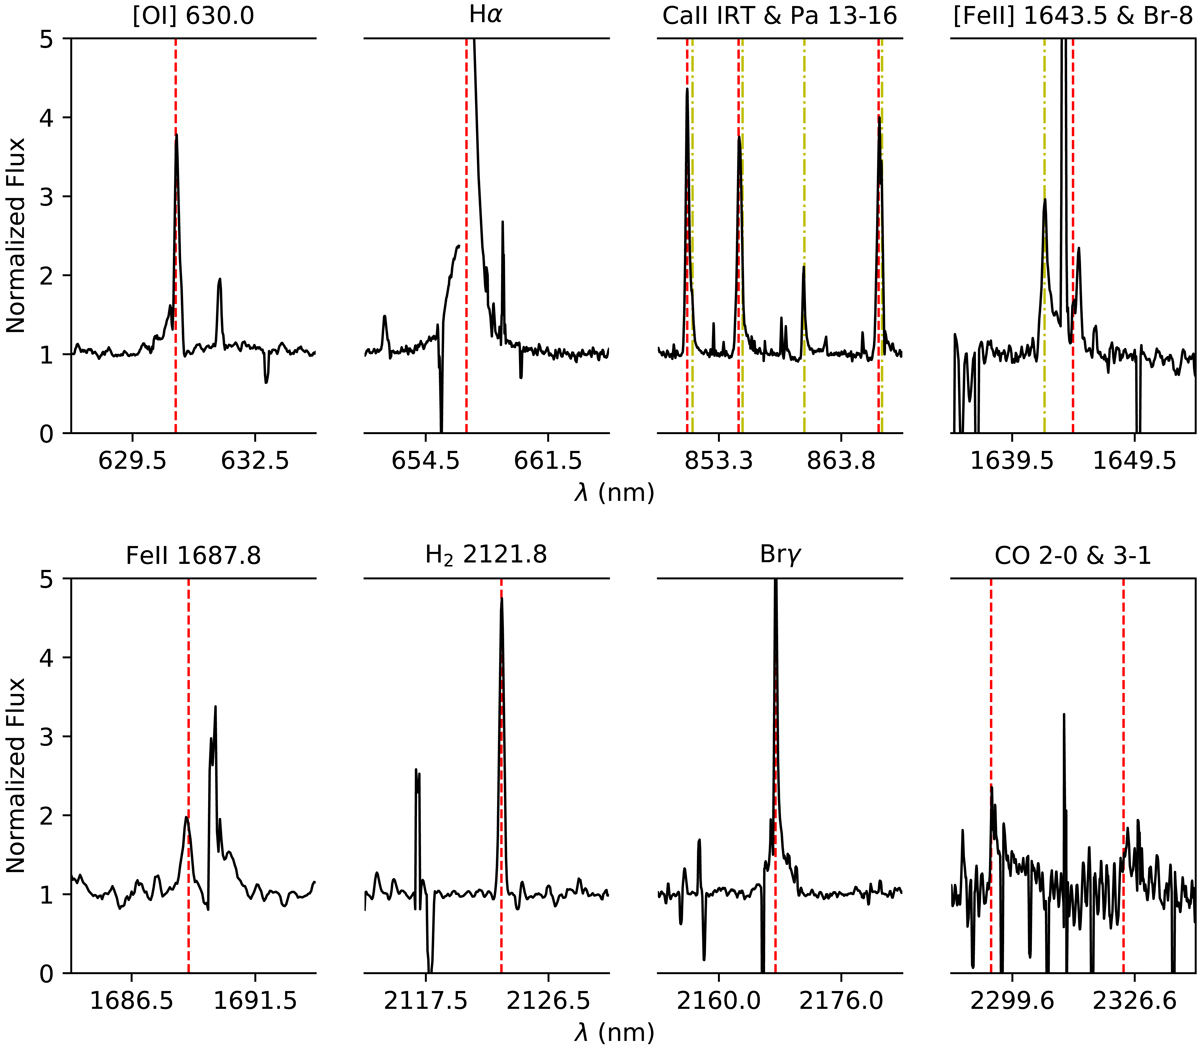
[O I] 630.0 nm, Hα, Ca II IRT and Pa-13–16, [Fe II] 1643.5 nm, Fe II 1687.7 nm, H2 2121.8 nm, Brγ, and the 2–0 and 3–1 CO bandhead regions shown for S4. For clarity, the [Fe II] 1643.5 nm, Fe II 1687.7 nm, H2 2121.8 nm, Brγ, and CO bandhead regions have been enhanced by a factor of 5 and 15, respectively. We indicate the positions of the transitions by the red dashed lines. The Pa series and Br-8 line are marked by yellow dash-dotted lines for clarification. The center of Hα was saturated due to nebular emission and has been clipped. All narrow features are either telluric lines or residuals from the nebular or sky subtraction.
Current usage metrics show cumulative count of Article Views (full-text article views including HTML views, PDF and ePub downloads, according to the available data) and Abstracts Views on Vision4Press platform.
Data correspond to usage on the plateform after 2015. The current usage metrics is available 48-96 hours after online publication and is updated daily on week days.
Initial download of the metrics may take a while.