Fig. 8.
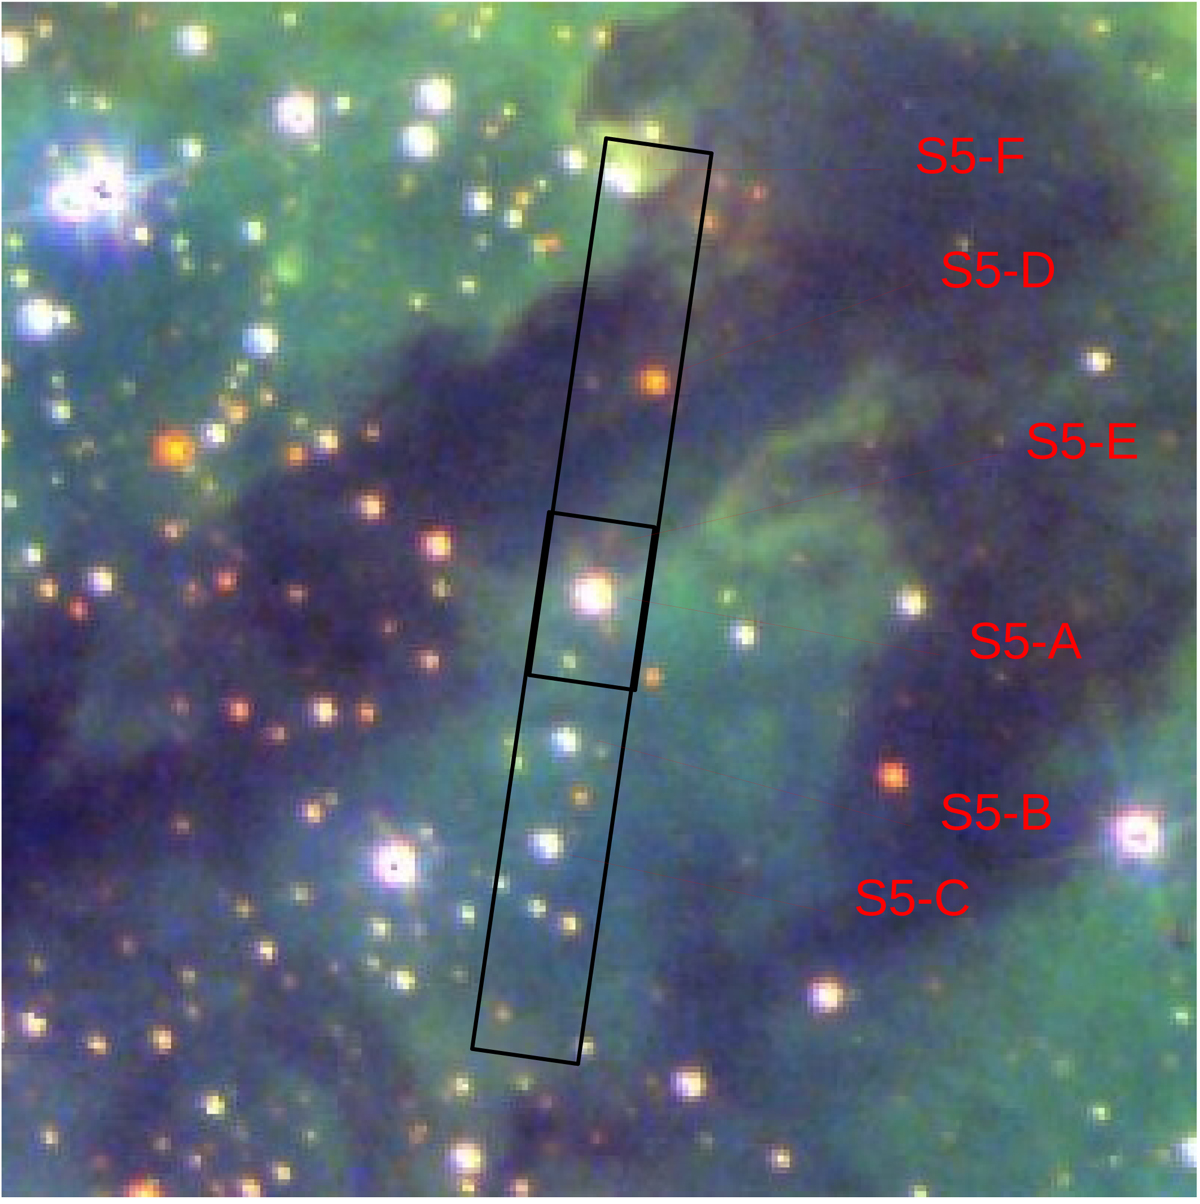
HST/WFPC2/F814W (red) +F555W (green) +F336W (blue) composite image (20″ × 20″) of the cluster field surrounding S5 (Walborn et al. 2002). North is up and east is to the left. The two nodding positions of the X-shooter slit are shown with the two black rectangles. We identify a total of six continuum sources in our observation, which we labeled A–F (indicated in red). Even though S5-E is not visible in this image, we still indicate its presumed location.
Current usage metrics show cumulative count of Article Views (full-text article views including HTML views, PDF and ePub downloads, according to the available data) and Abstracts Views on Vision4Press platform.
Data correspond to usage on the plateform after 2015. The current usage metrics is available 48-96 hours after online publication and is updated daily on week days.
Initial download of the metrics may take a while.