Fig. 9.
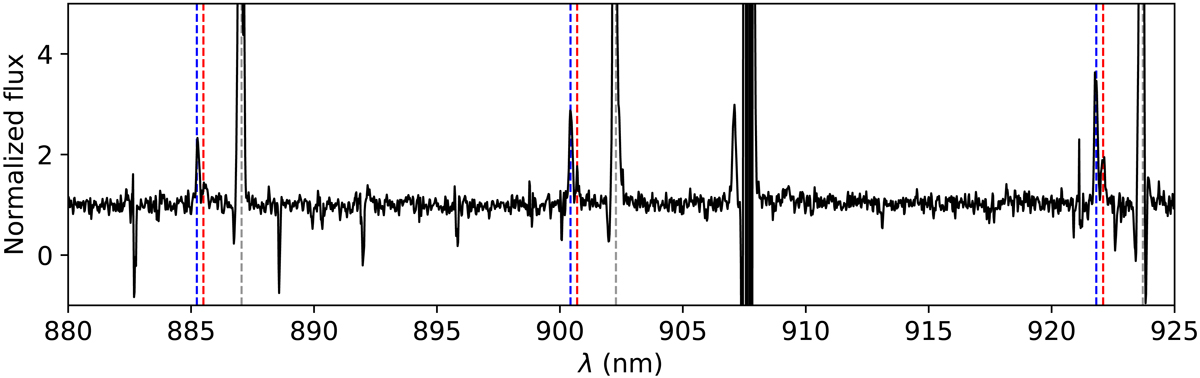
Spectrum of S7-B centered around the three Pa lines. With the blue and red vertical dashed lines, we denote the locations of the blueshifted and redshifted peaks of emission at −355 km s−1 and −265 km s−1, respectively. The nebular counterpart of the Pa lines is indicated with the gray vertical lines at 250 km s−1. The region around ∼908 nm is a saturated [S III] nebular line. Other narrow features are either telluric features or residuals from the nebular subtraction.
Current usage metrics show cumulative count of Article Views (full-text article views including HTML views, PDF and ePub downloads, according to the available data) and Abstracts Views on Vision4Press platform.
Data correspond to usage on the plateform after 2015. The current usage metrics is available 48-96 hours after online publication and is updated daily on week days.
Initial download of the metrics may take a while.