Fig. 1
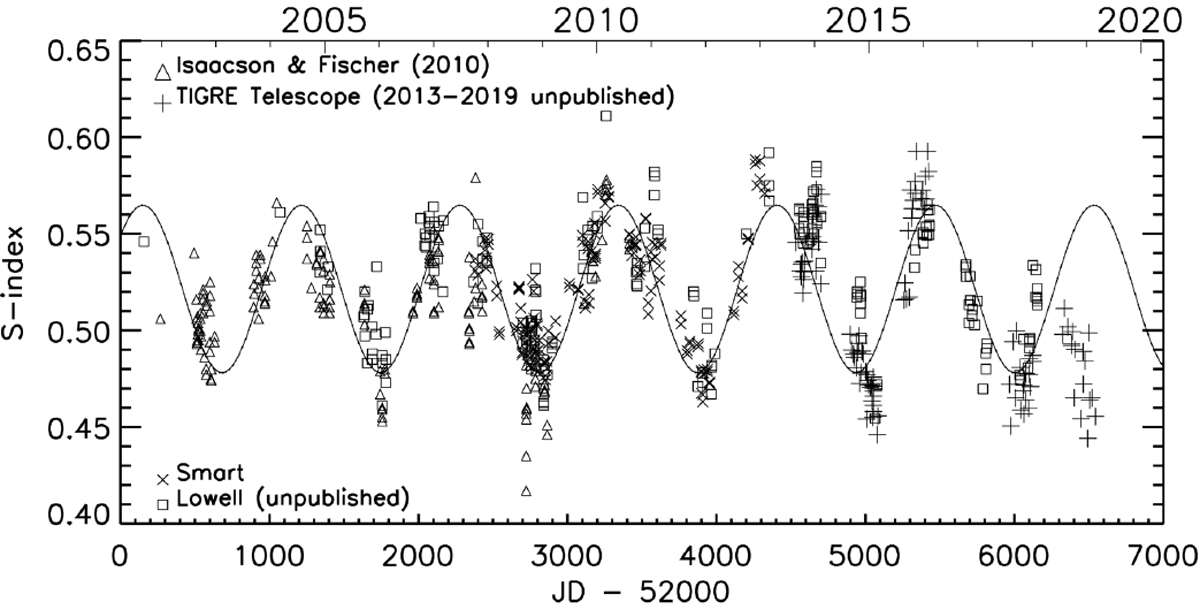
Ca II Mount Wilson S-index of ɛ Eri. Data set covers a period from 2002 to late 2018 and it comes from four different instruments: the SMARTS 1.5 m telescope (cross-symbols), SSS at Lowell Observatory (squared-symbols), HIRES at the Keck Observatory (triangle-symbols), and the TIGRE telescope at La Luz Observatory (plus-symbols). The solid line is the sinusoidal function representing the peak with the highest power in the periodogram (see Sect. 2.1.4).
Current usage metrics show cumulative count of Article Views (full-text article views including HTML views, PDF and ePub downloads, according to the available data) and Abstracts Views on Vision4Press platform.
Data correspond to usage on the plateform after 2015. The current usage metrics is available 48-96 hours after online publication and is updated daily on week days.
Initial download of the metrics may take a while.