Fig. 10
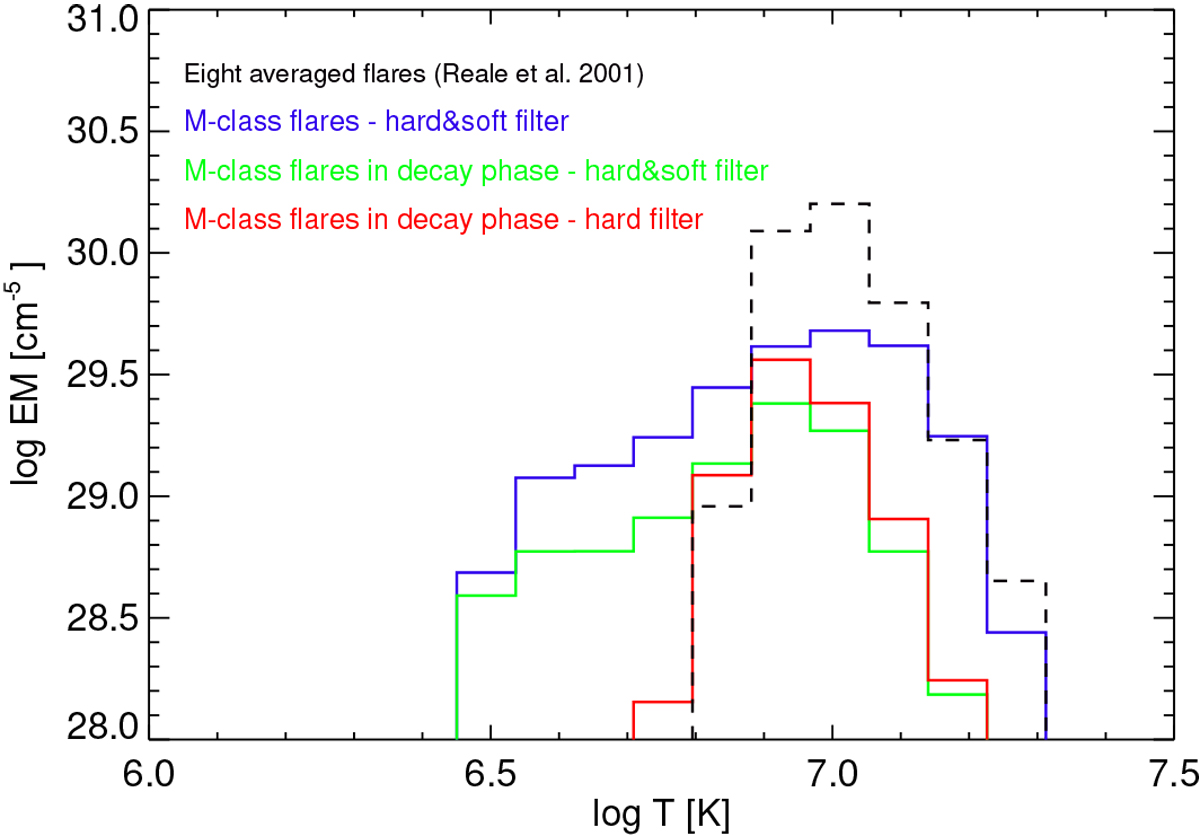
Flare EM(T) distributions used to modify solar coronal EMD, normalized to unit surface. Black distribution: time-averaged flares presented in Reale et al. (2001) generated according to Orlando et al. (2017); blue distribution: contribution of flares at soft and hard energies; green distributions: contribution of flares in the decay phase; red distribution: contribution of flares at the lowest temperatures.
Current usage metrics show cumulative count of Article Views (full-text article views including HTML views, PDF and ePub downloads, according to the available data) and Abstracts Views on Vision4Press platform.
Data correspond to usage on the plateform after 2015. The current usage metrics is available 48-96 hours after online publication and is updated daily on week days.
Initial download of the metrics may take a while.