Fig. 12
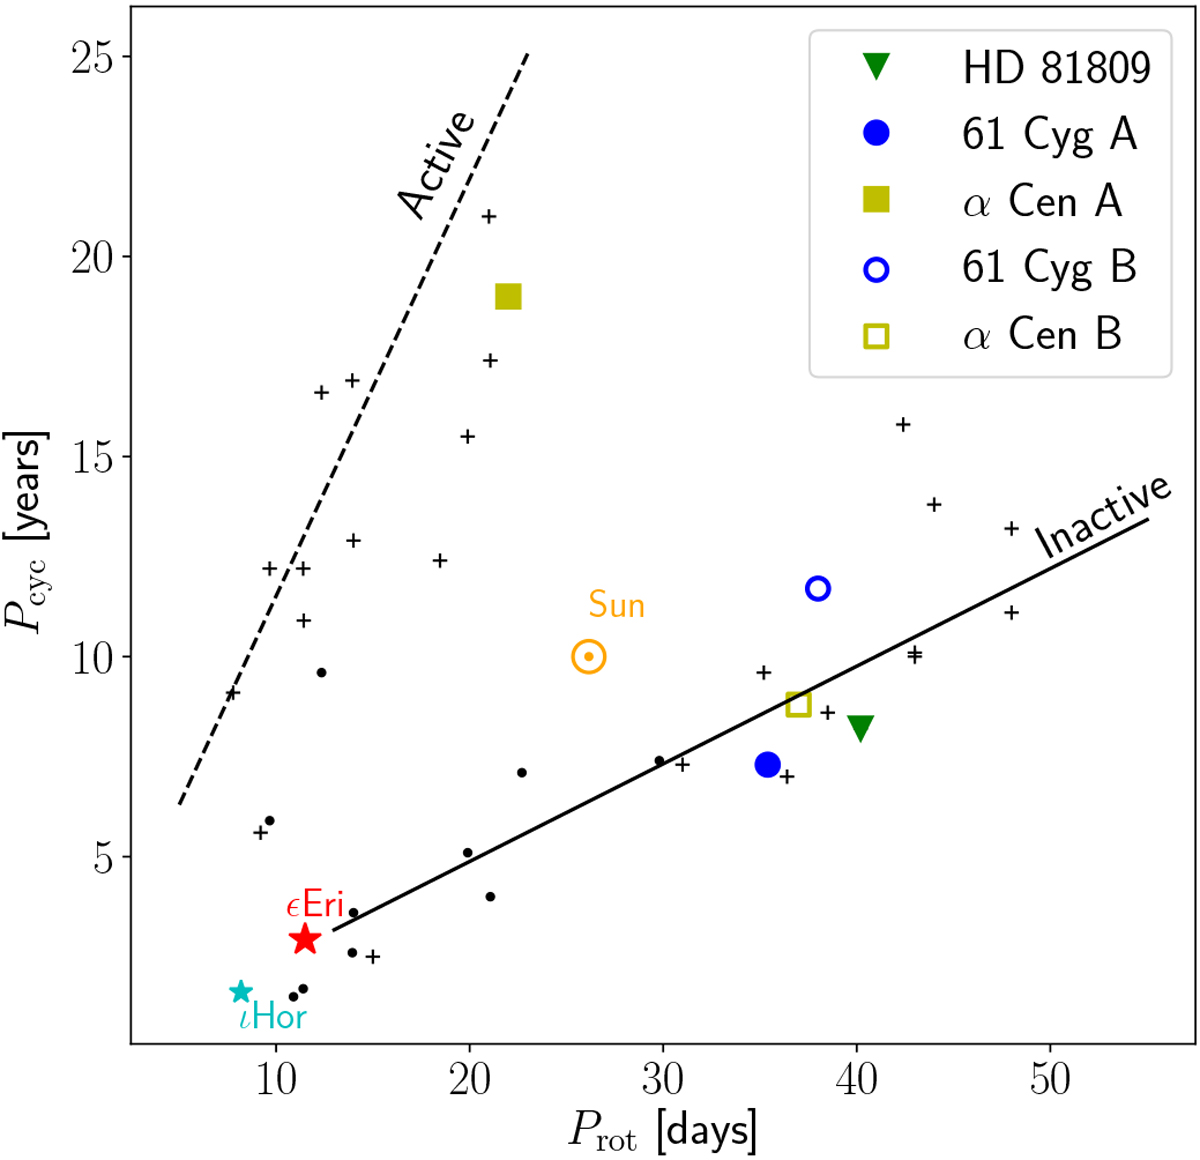
Cycle period, Pcyc, as function of the rotational period, Prot. Dotted line: active (A) branch; solid line: inactive (I) branch; black dots and crosses: original data of Böhm-Vitense (2007), updated with the new measurements available in Brandenburg et al. (2017); the black dots are secondary periods of some stars on the A branch; colored symbols: cycles detected in X-rays (Robrade et al. 2012; Orlando et al. 2017; Sanz-Forcada et al. 2013).
Current usage metrics show cumulative count of Article Views (full-text article views including HTML views, PDF and ePub downloads, according to the available data) and Abstracts Views on Vision4Press platform.
Data correspond to usage on the plateform after 2015. The current usage metrics is available 48-96 hours after online publication and is updated daily on week days.
Initial download of the metrics may take a while.