Fig. 15
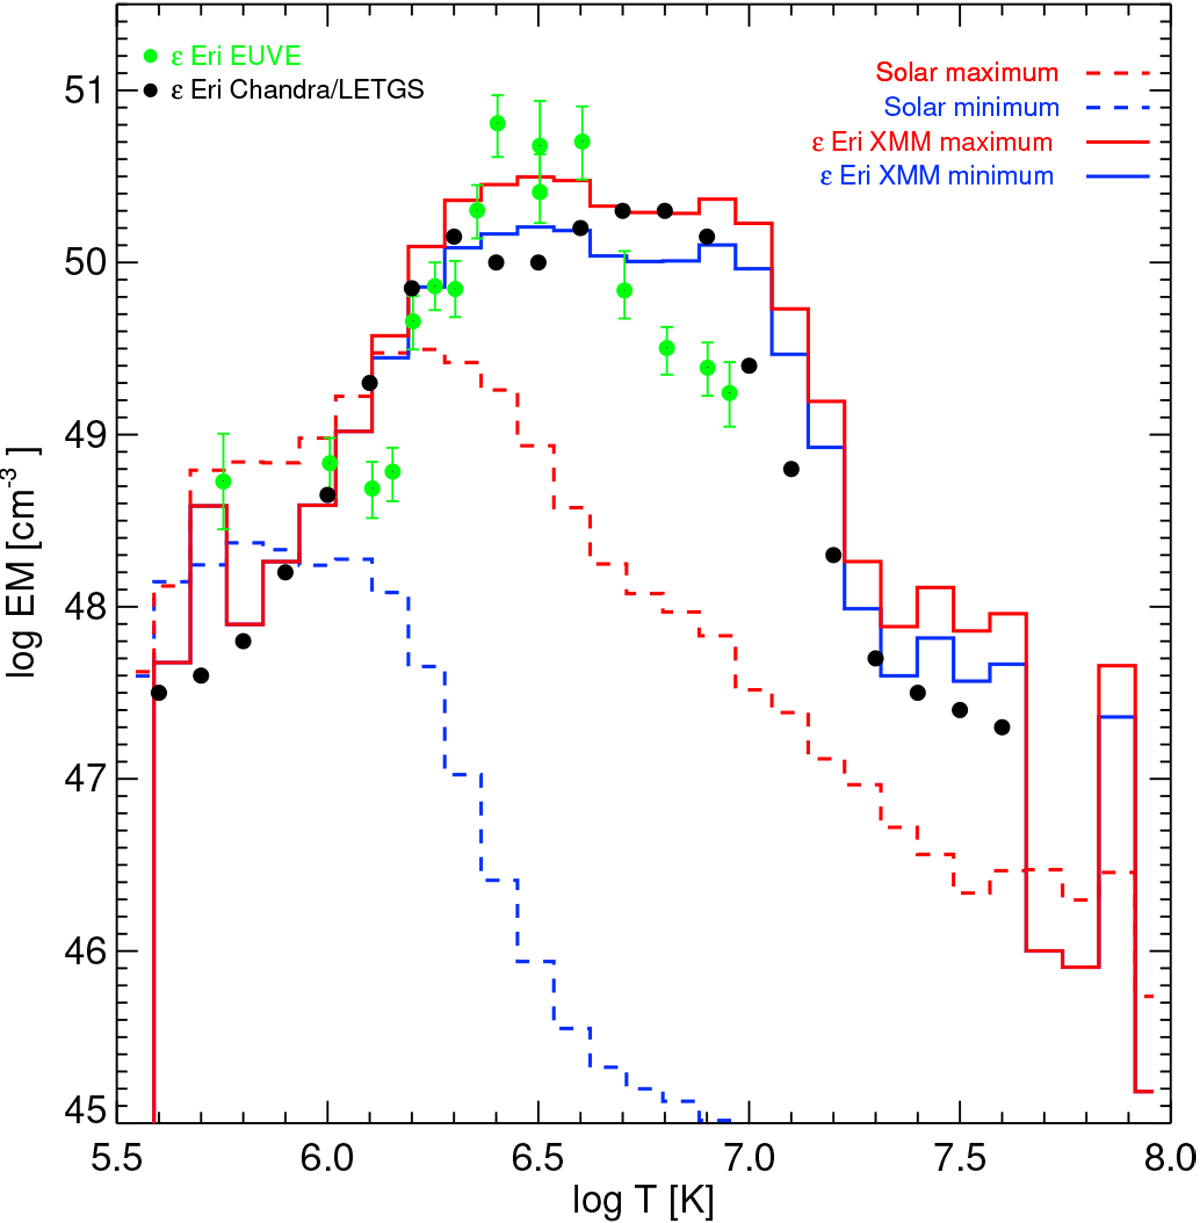
EMDs of the Sun and ɛ Eri. Dashed lines: solar EMDs during the minimum in April 1996 (blue) and the maximum in December 1991 (red) of the solar cycle; solid lines: EPIC/pn EMDs of ɛ Eri during the minimum in February 2015 (blue) and maximum in July 2018 (red) of its X-ray cycle; green dots: EMD of ɛ Eri from the EUVE spectra of 1993 (Drake et al. 2000);blacks dots: EMD of ɛ Eri from Chandra/LETGS spectrum taken in March 2001 (Sanz-Forcada et al. 2004).
Current usage metrics show cumulative count of Article Views (full-text article views including HTML views, PDF and ePub downloads, according to the available data) and Abstracts Views on Vision4Press platform.
Data correspond to usage on the plateform after 2015. The current usage metrics is available 48-96 hours after online publication and is updated daily on week days.
Initial download of the metrics may take a while.