Fig. 3
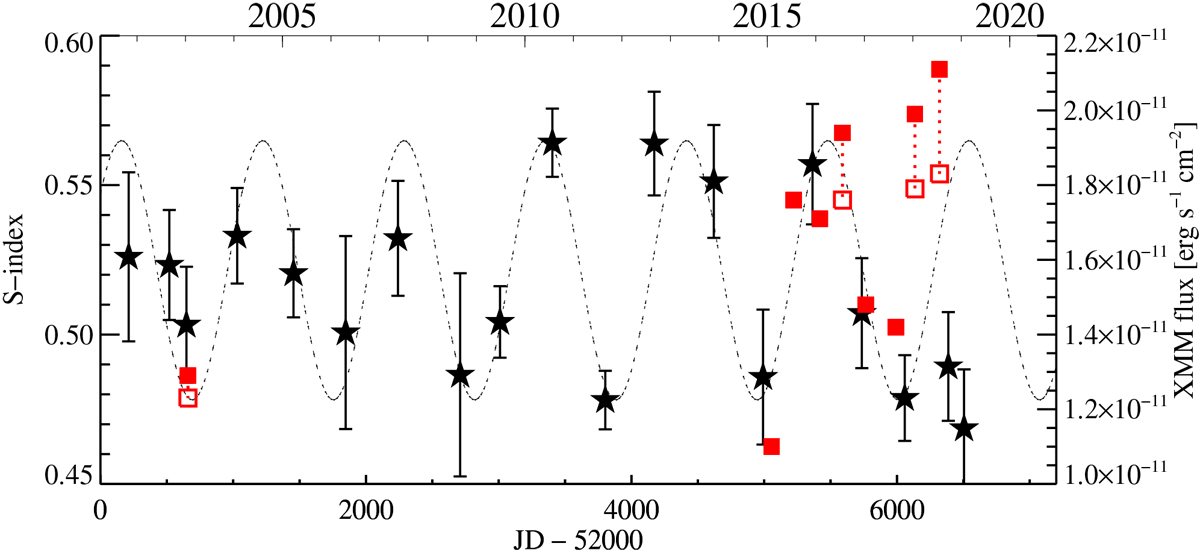
Long-term lightcurve of ɛ Eri starting from 2002. The binned Ca II S-index data are plotted with star symbols. The X-ray fluxes are overplotted as red squares. The filled squares refer to the X-ray fluxes calculated over the complete lightcurve of each observation. For those observations with a flare-like short term variability, the X-ray fluxes are also calculated after the removal of the flare and shown as open squares.
Current usage metrics show cumulative count of Article Views (full-text article views including HTML views, PDF and ePub downloads, according to the available data) and Abstracts Views on Vision4Press platform.
Data correspond to usage on the plateform after 2015. The current usage metrics is available 48-96 hours after online publication and is updated daily on week days.
Initial download of the metrics may take a while.