Fig. 7
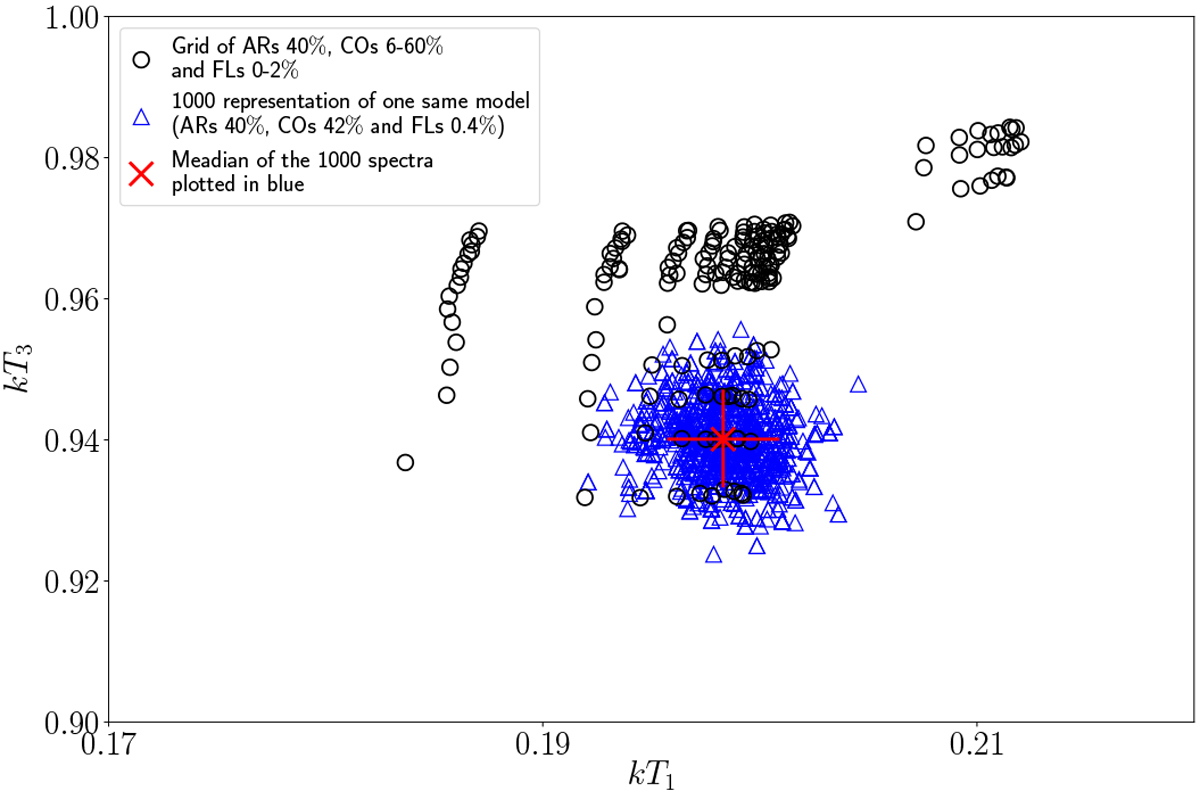
Example showing effect of the Poisson statistics on retrieved spectral parameters (kT1 vs. kT3) of the synthetic spectra of the grid with ARs 40%, COs 6–60% and FLs 0–2%. Black circles: medians of the 1000 representations of each grid point; blue triangles: 1000 best-fit parameters representing one specific combination of magnetic structures (ARs 40%, COs 42%, FLs 0.4%); red cross: median of the 1000 representations (plotted in blue) of the model with COs 42% and FLs 0.4%, which we chose to highlight as an example.
Current usage metrics show cumulative count of Article Views (full-text article views including HTML views, PDF and ePub downloads, according to the available data) and Abstracts Views on Vision4Press platform.
Data correspond to usage on the plateform after 2015. The current usage metrics is available 48-96 hours after online publication and is updated daily on week days.
Initial download of the metrics may take a while.