Fig. 27.
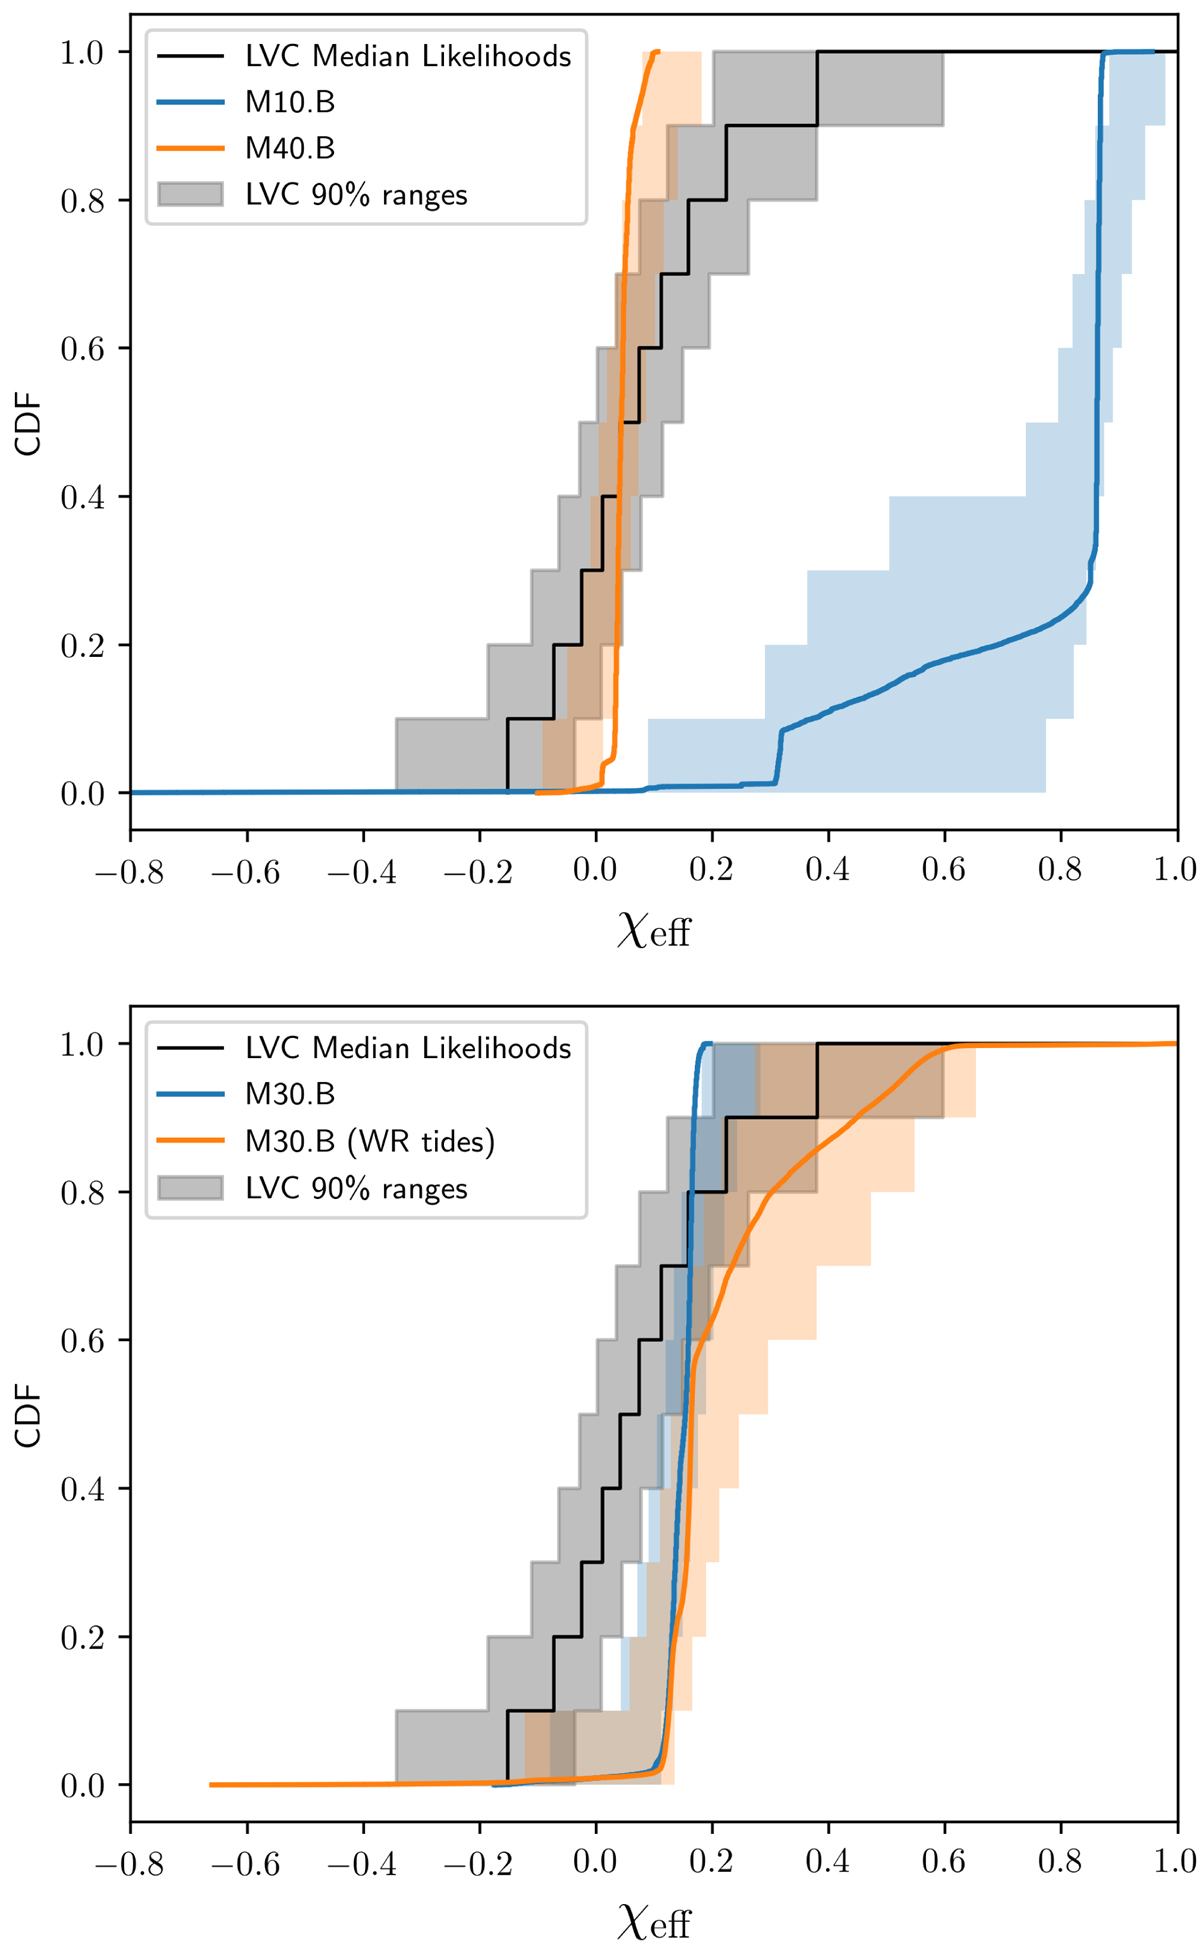
Cumulative density functions (CDFs) of four StarTrack models versus effective spins χeff. Solid color lines correspond to χeff CDF of detectable events for each model. The black line shows the χeff CDF of median likelihoods of the O1/O2 LVC events, and the gray region bounds CDFs of the 5th and 95th percentiles of the likelihoods from LVC parameter estimation. In the corresponding colored shaded regions, we show the 90% range of 5000 mock observed CDFs under each model. To generate a mock observed CDF, we draw 10 χeff values from the detected population under a given model and add random Gaussian noise with σ = 0.05, which is approximately the uncertainty in χeff likelihoods from the events of GWTC-1 (we resample any samples with |χeff| > 1 after adding noise).
Current usage metrics show cumulative count of Article Views (full-text article views including HTML views, PDF and ePub downloads, according to the available data) and Abstracts Views on Vision4Press platform.
Data correspond to usage on the plateform after 2015. The current usage metrics is available 48-96 hours after online publication and is updated daily on week days.
Initial download of the metrics may take a while.