Fig. A.1.
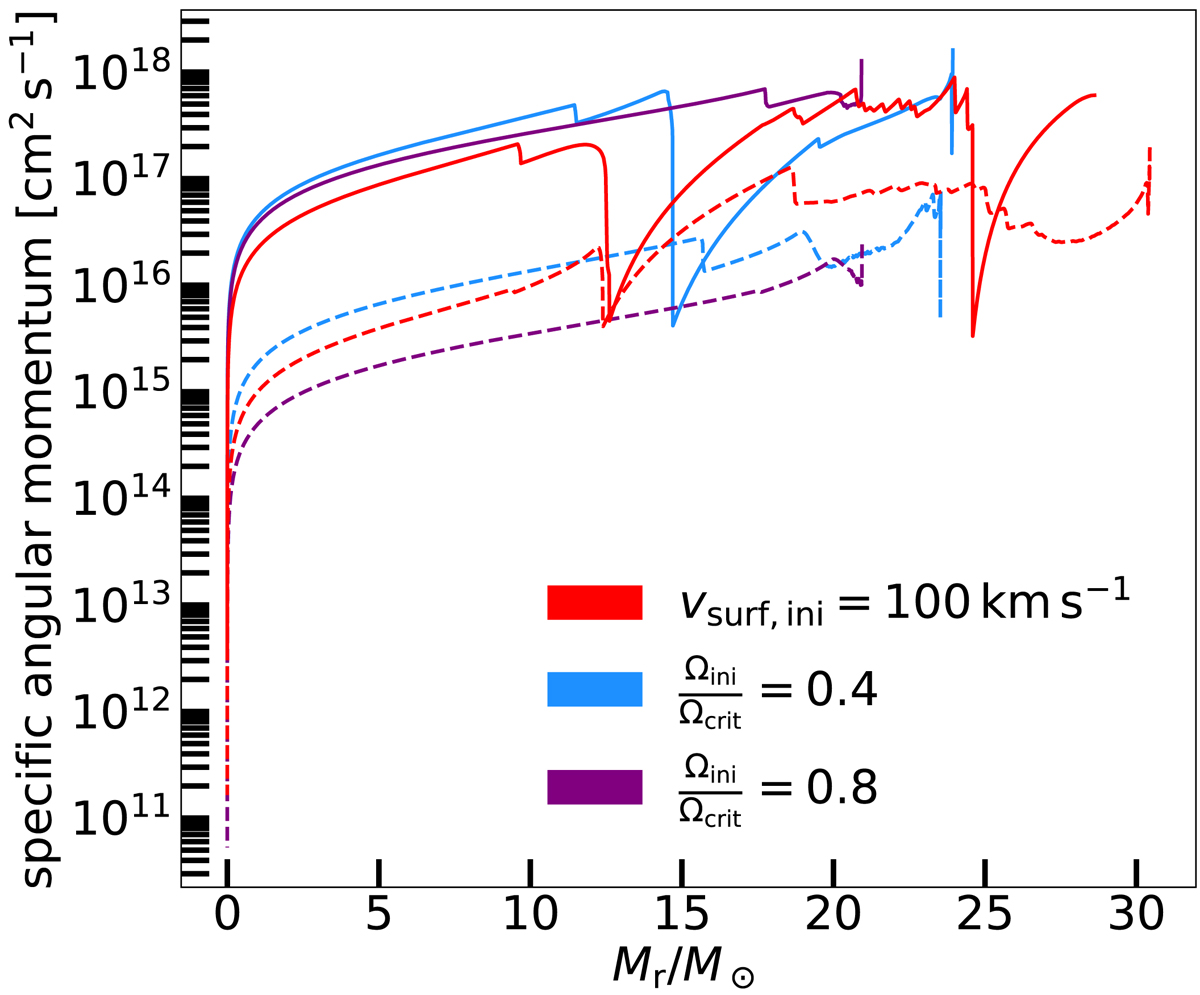
Specific angular momentum profile at the end of core helium burning for the 32 M⊙ MESA models at Z = 0.002. The models were calculated with different initial rotation rates; slow (100 km s−1, red), fast (40% of critical rotation, blue) and very fast (80% of critical rotation, purple). Magnetic (dashed line) and non-magnetic models (solid line) are considered. Large dips in the curve indicate the base of a convective region, where angular momentum transport is very efficient. The maximal extent of the curves to the right indicate the mass of the star. We can see from these curves that the faster rotating models lose more mass in winds due to rotation-enhanced mass loss.
Current usage metrics show cumulative count of Article Views (full-text article views including HTML views, PDF and ePub downloads, according to the available data) and Abstracts Views on Vision4Press platform.
Data correspond to usage on the plateform after 2015. The current usage metrics is available 48-96 hours after online publication and is updated daily on week days.
Initial download of the metrics may take a while.