Fig. 1
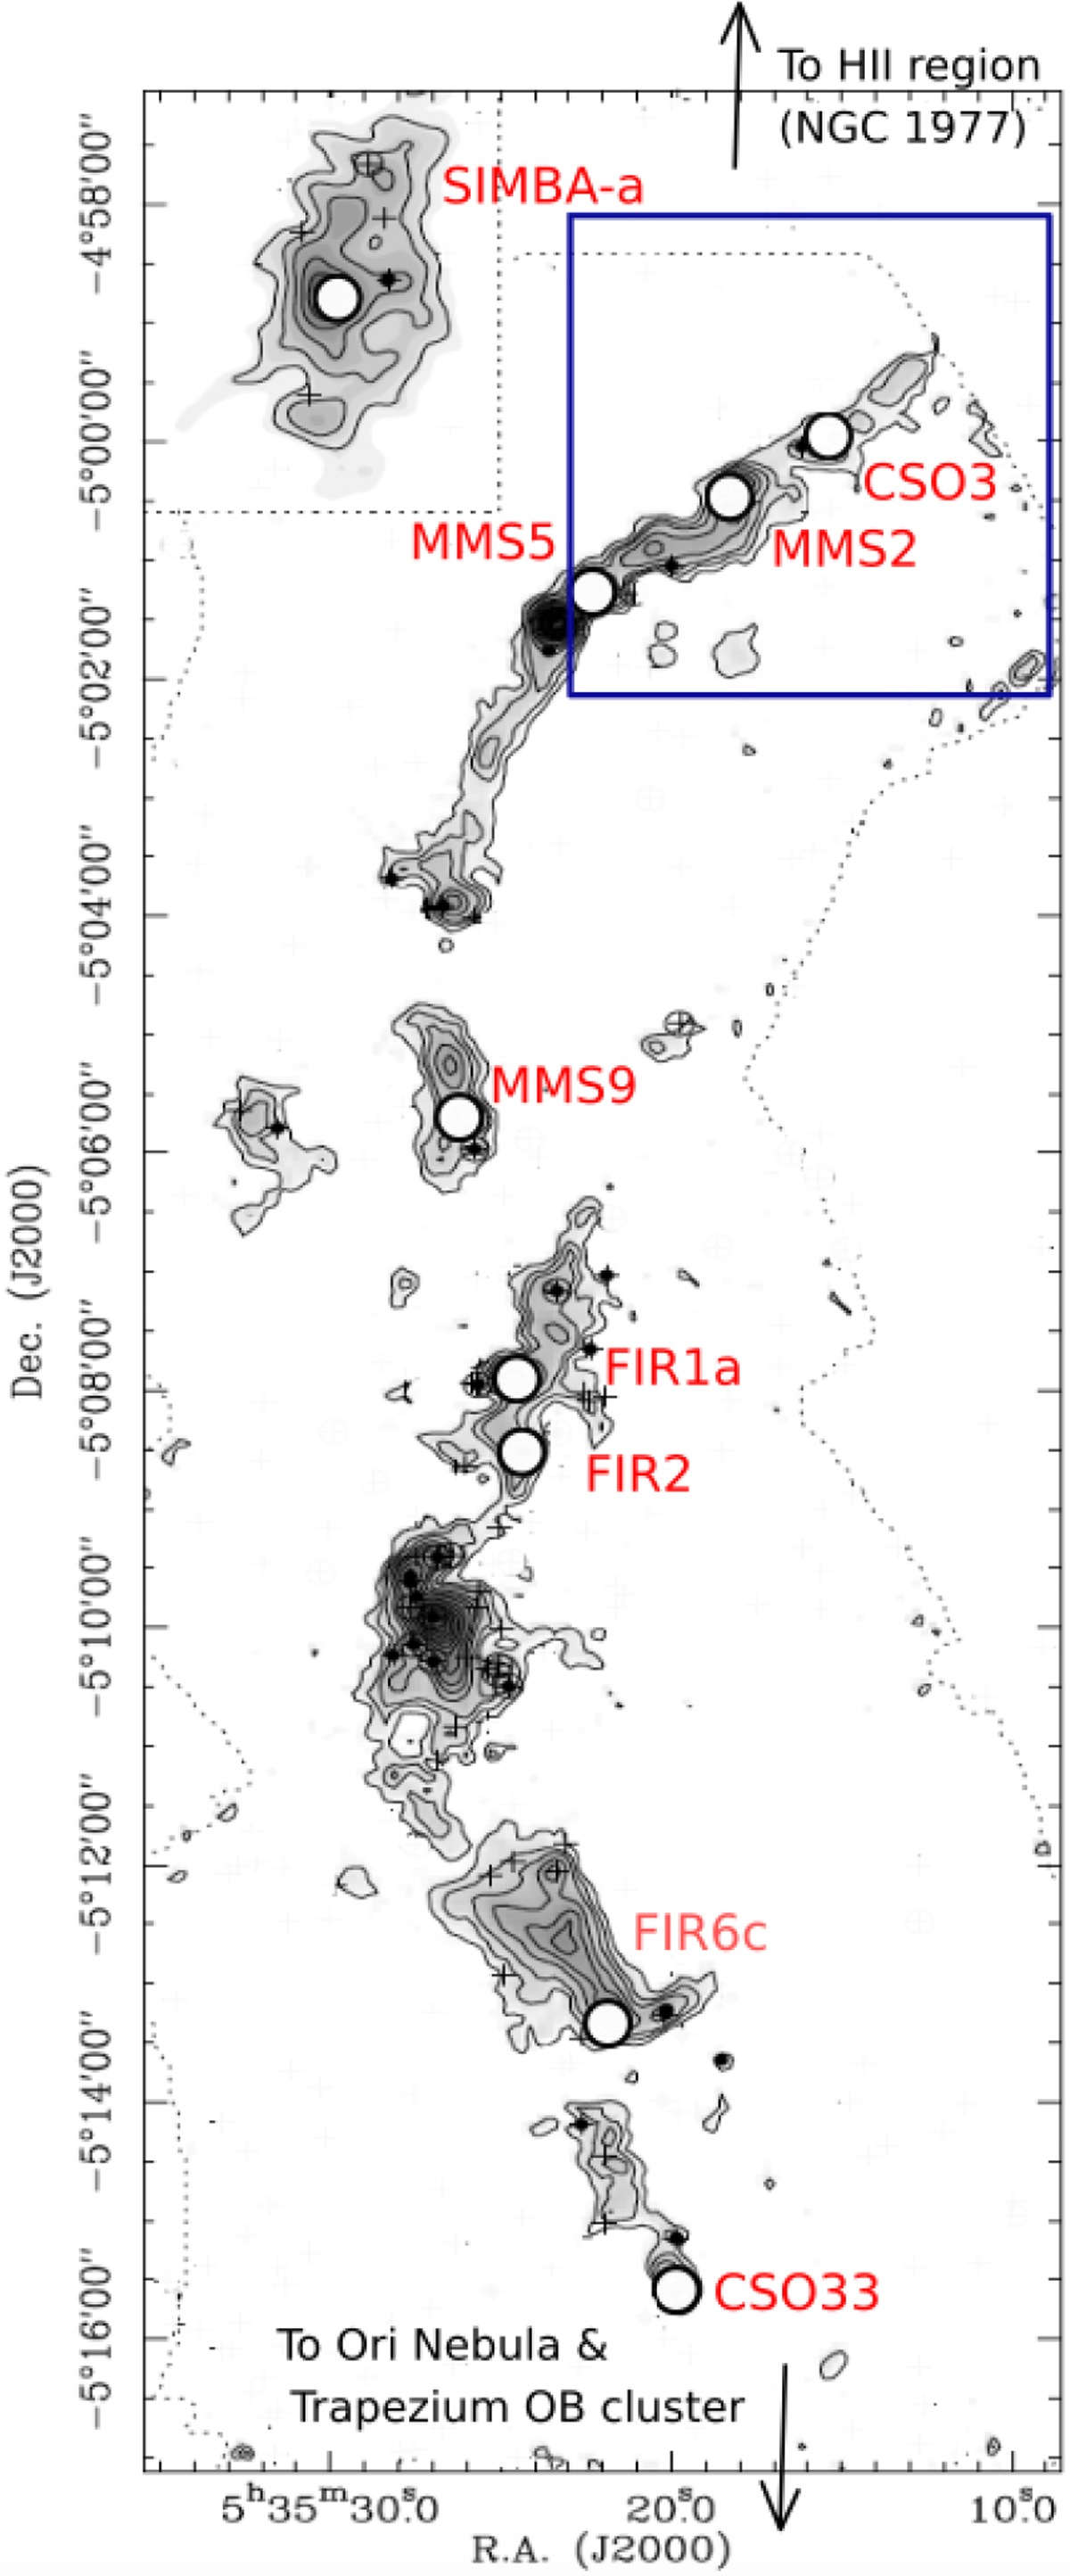
Map of the continuum at 1.3 mm towards the OMC-2/3 filament, adapted from Chini et al. (1997) and Nielbock et al. (2003). The upper left insert (square grid) is taken from the SIMBA map of Nielbock et al. (2003) and added on the 1.3 mm map of Chini et al. (1997) whose limits are represented by the dotted lines. Contours rise linearly from a 3σ rms noise level (Nielbock et al. 2003), the rms noise of the map being 25 mJy (Chini et al. 1997). The selected targets of the present study are marked with white circles, which have the size of the IRAM-30 m beam at 1.3 mm. The names of the sources are reported in red (see Table 2). Please note that some black crosses and filled dots are present throughout the figure. They represent some of the 2MASS sources and MIR sources from TIMMI 2 observed by Nielbock et al. (2003). The blue square indicates the region mapped with IRAM-30 m at 3 mm. The two arrows show the direction of the HII region NGC 1977 (top) and the Ori Nebula and Trapezium OB cluster (bottom).
Current usage metrics show cumulative count of Article Views (full-text article views including HTML views, PDF and ePub downloads, according to the available data) and Abstracts Views on Vision4Press platform.
Data correspond to usage on the plateform after 2015. The current usage metrics is available 48-96 hours after online publication and is updated daily on week days.
Initial download of the metrics may take a while.