Fig. 3
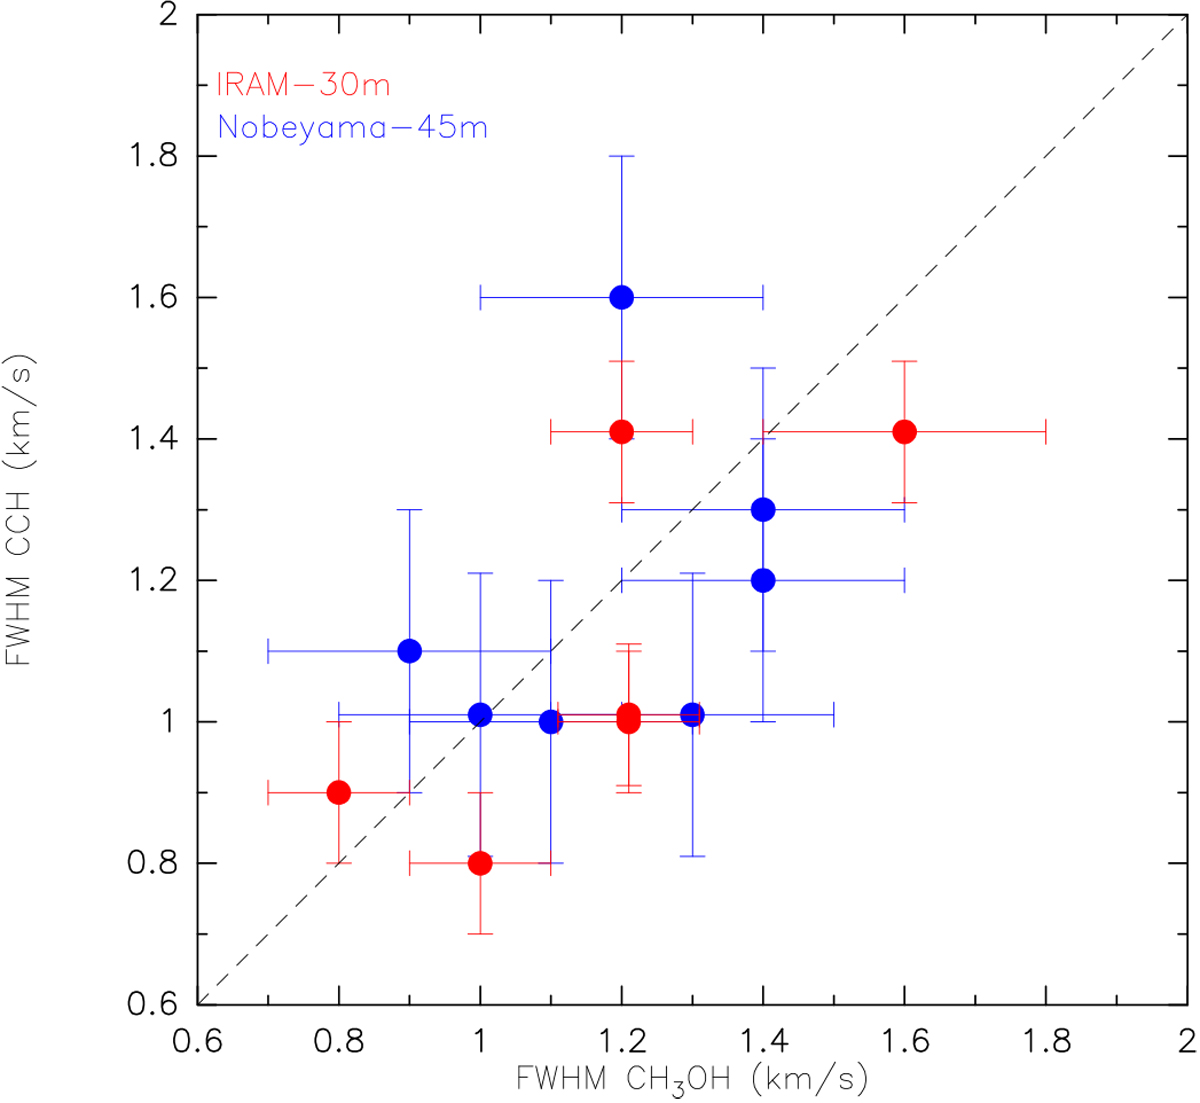
Average widths (FWHM) of the CCH (y-axis) and CH3OH (x-axis) lines observed in each source of Table 2, using the IRAM-30 m (red) and the Nobeyama-45 m (blue), respectively. The errors are 1σ of the average values. This shows that the two molecules are emitted in a similar and quiescent region (Sect. 5.1). We note that only six sources are reported for the IRAM-30 m observations and seven for the Nobeyama-45 m: this is because the sources FIR6c and FIR2 have been left out from the analysis in both set of observations, the lines being blended with outflows (see Table 2). The source SIMBA-a is contaminated by the wobbler off position only in the IRAM-30 m data set. We could thus perform the analysis with Nobeyama-45 m (see Table 2).
Current usage metrics show cumulative count of Article Views (full-text article views including HTML views, PDF and ePub downloads, according to the available data) and Abstracts Views on Vision4Press platform.
Data correspond to usage on the plateform after 2015. The current usage metrics is available 48-96 hours after online publication and is updated daily on week days.
Initial download of the metrics may take a while.