Open Access
Fig. 5
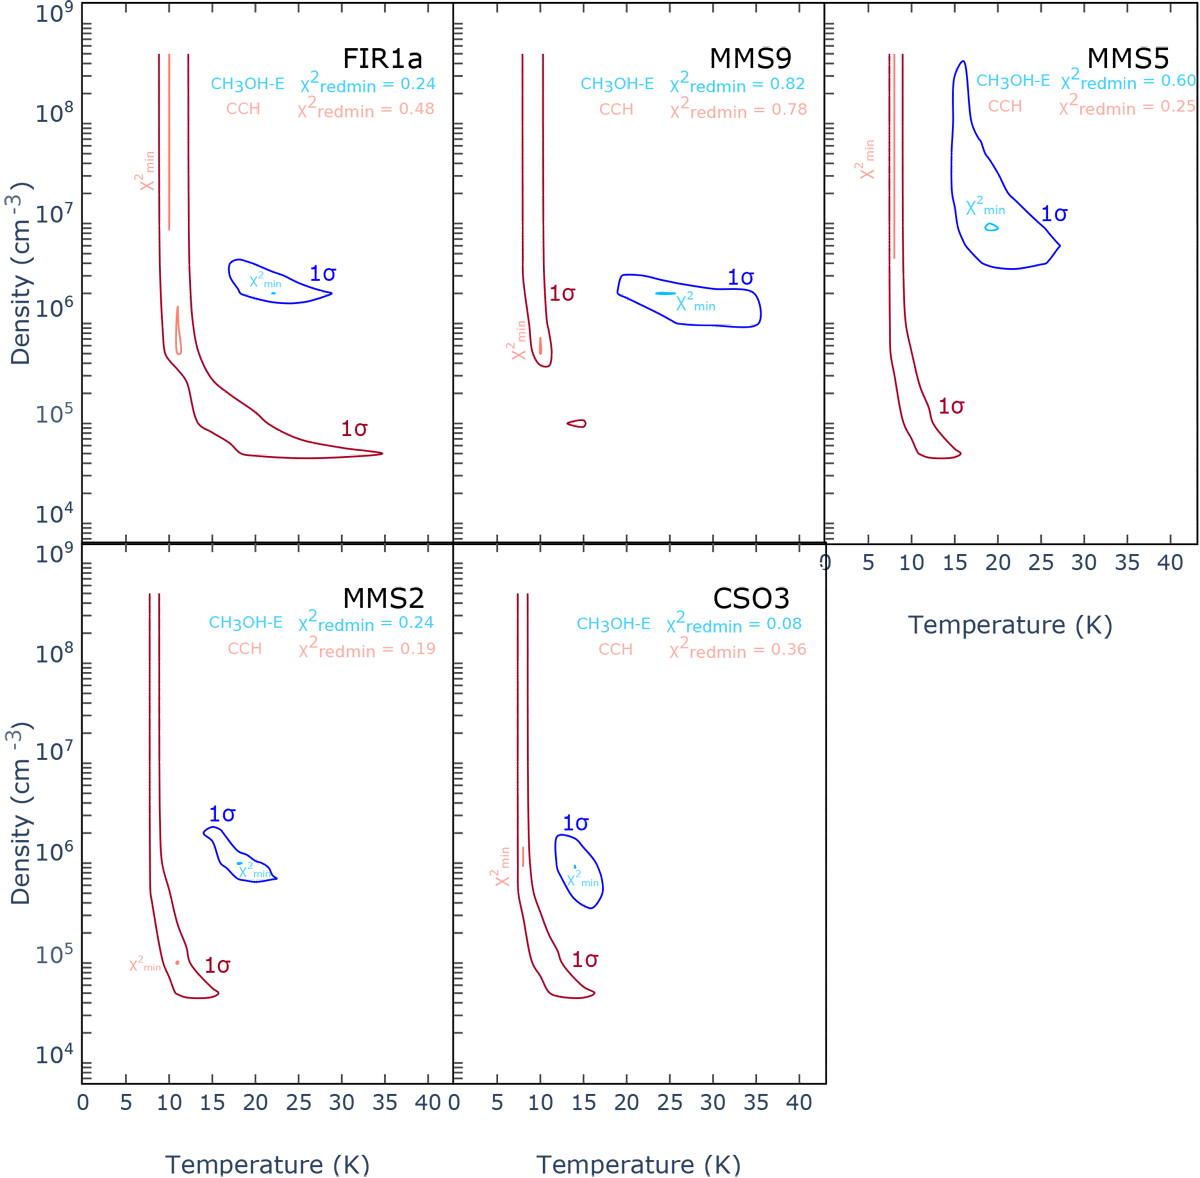
Density versus temperature contour plot for all the sources except CSO33 (see Fig. 6). The minimum χ2 and the 1σ contour plot are obtained for a minimum value of the χ2 in the column density parameter. The values of the reduced ![]() are quoted in the upper corner of each panel.
are quoted in the upper corner of each panel.
Current usage metrics show cumulative count of Article Views (full-text article views including HTML views, PDF and ePub downloads, according to the available data) and Abstracts Views on Vision4Press platform.
Data correspond to usage on the plateform after 2015. The current usage metrics is available 48-96 hours after online publication and is updated daily on week days.
Initial download of the metrics may take a while.