Fig. 8
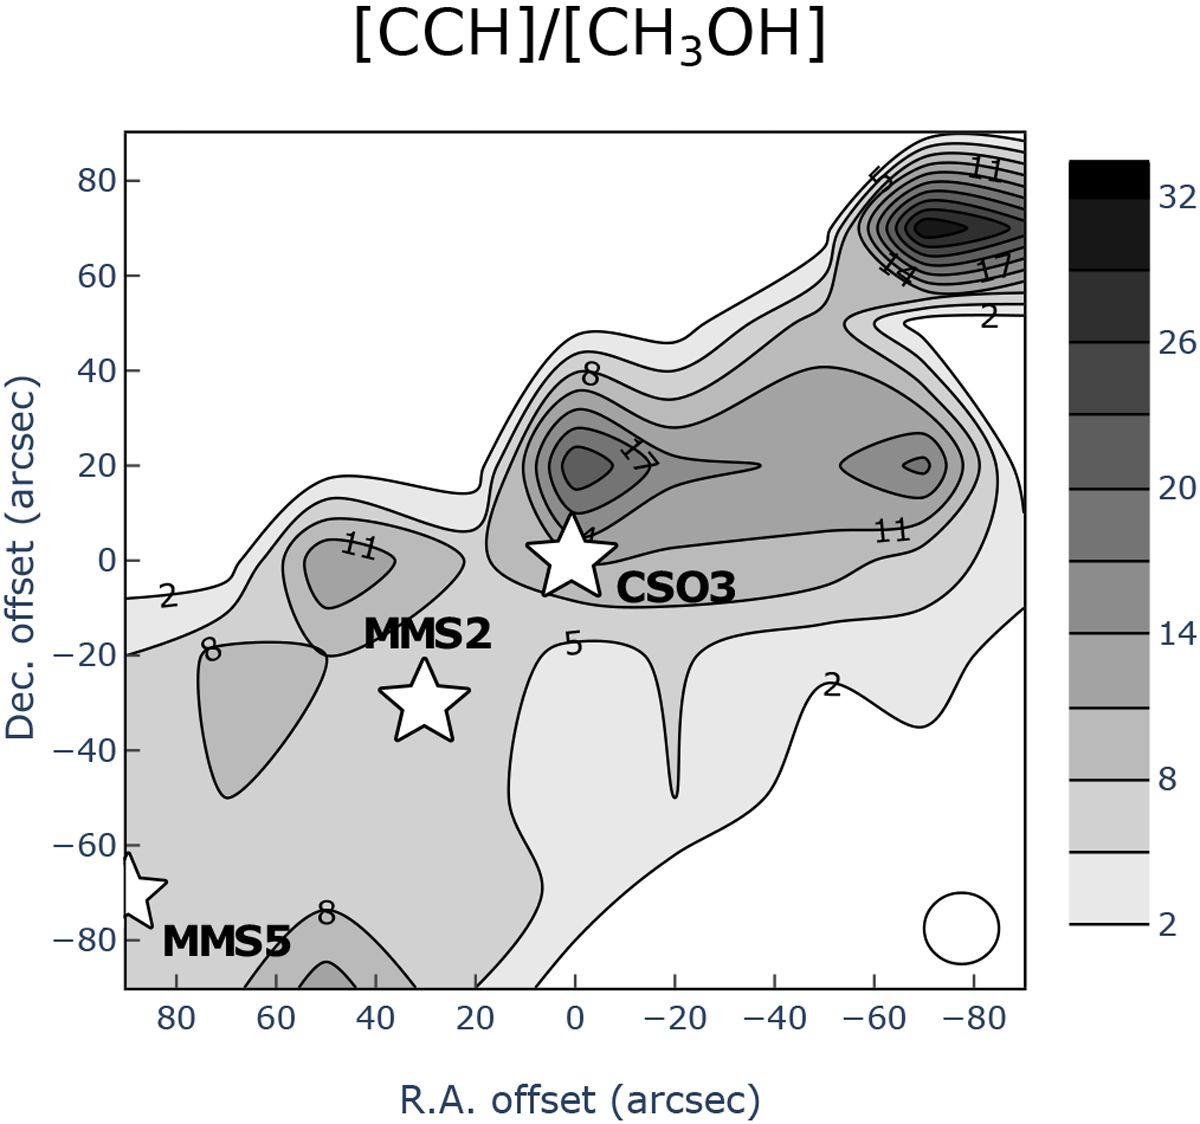
Map of the [CCH]/[CH3OH] abundance ratio as derived via the LTE analysis described in Sect. 6.4. The sources MMS5, MMS2, and CSO3 are represented by white stars. The beam size is the white circle at the bottom right of the figure. We note that the error bar in the derived [CCH]/[CH3OH] abundance ratio is about 4 (see Table C.3 of Appendix C).
Current usage metrics show cumulative count of Article Views (full-text article views including HTML views, PDF and ePub downloads, according to the available data) and Abstracts Views on Vision4Press platform.
Data correspond to usage on the plateform after 2015. The current usage metrics is available 48-96 hours after online publication and is updated daily on week days.
Initial download of the metrics may take a while.