Fig. 9
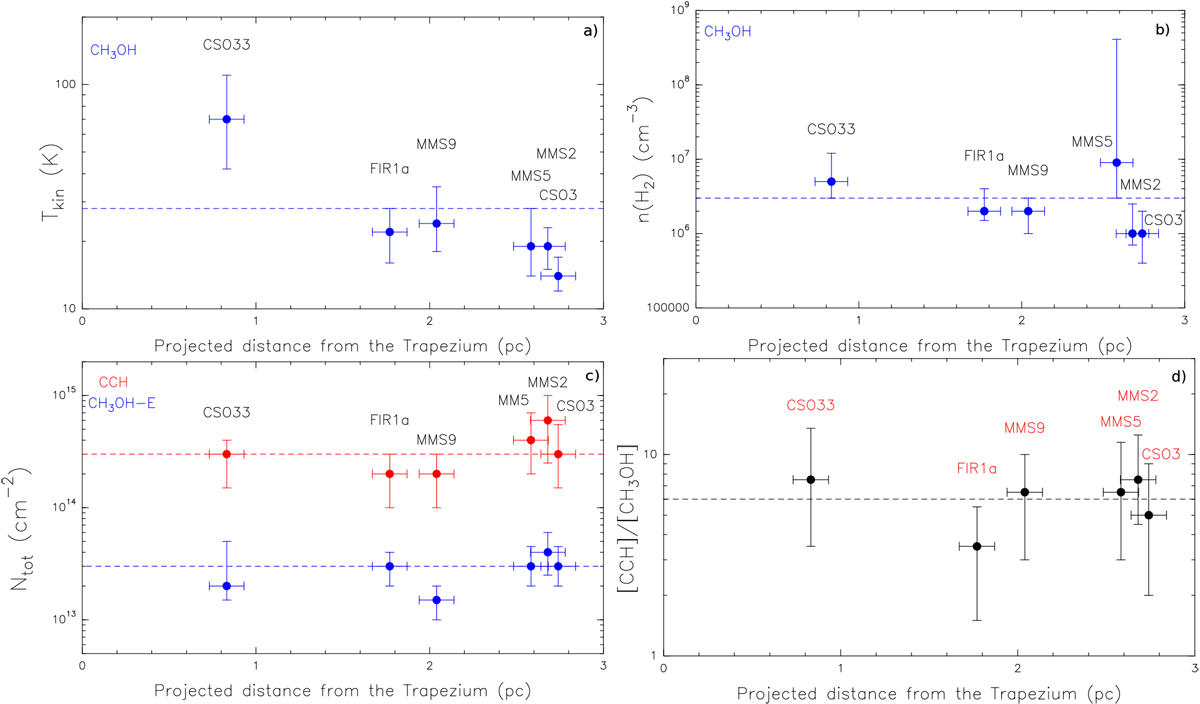
Results of the LVG analysis for each source. (a) kinetic temperatures (Tkin) of CH3 OH as a function of the distance to the Trapezium; (b) column densities (Ntot) of CCH and of CH3OH-E as afunction of the distance to the Trapezium; (c) derived gas density (nH2) for CH3 OH and CCH; (d) abundance ratio [CCH]/[CH3OH-E] as a function of the distance from the Trapezium. The red- and blue- dashed lines are the derived averaged values for each parameters for CCH and CH3OH-E respectively. The error bars are at 1σ.
Current usage metrics show cumulative count of Article Views (full-text article views including HTML views, PDF and ePub downloads, according to the available data) and Abstracts Views on Vision4Press platform.
Data correspond to usage on the plateform after 2015. The current usage metrics is available 48-96 hours after online publication and is updated daily on week days.
Initial download of the metrics may take a while.