Fig. 1
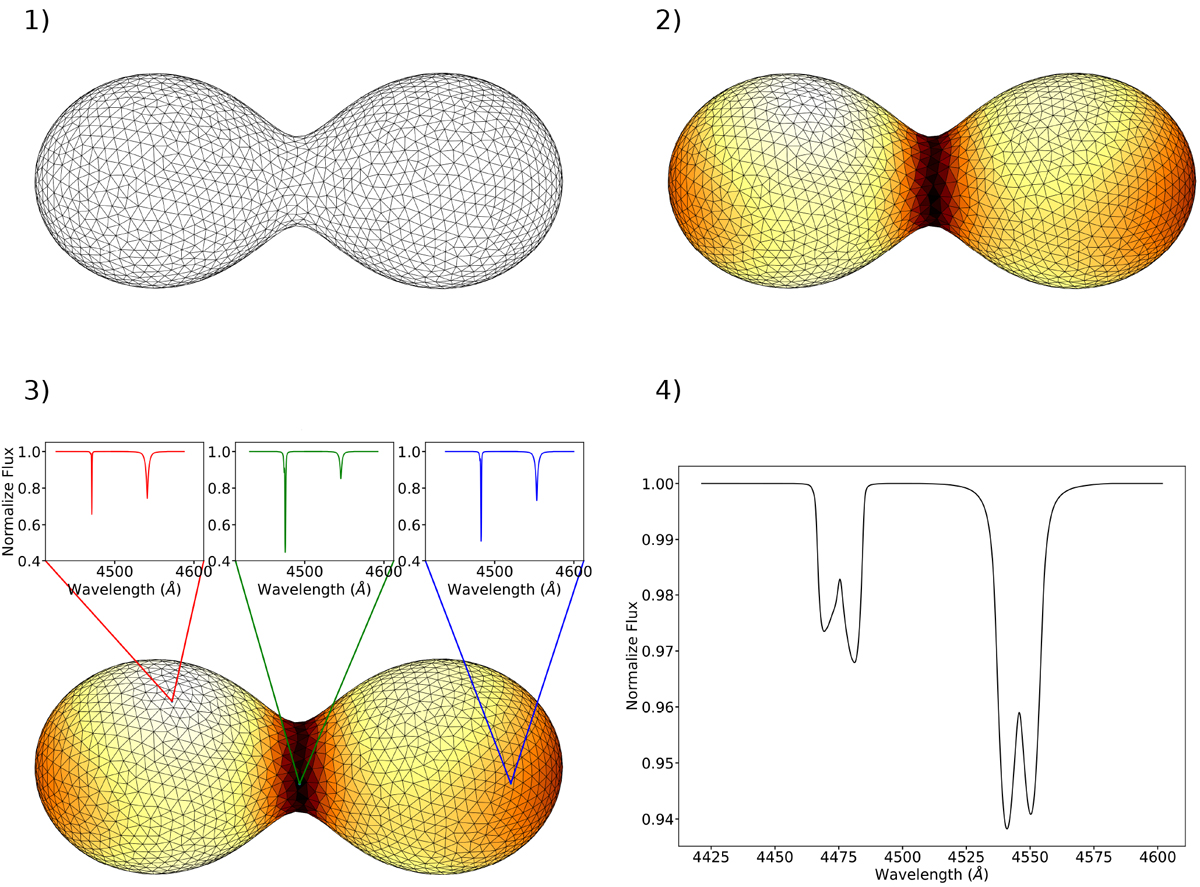
Example of the four steps of the patch model computation for an overcontact system. Top left: mesh representing the geometry of the system. Top right: same mesh, but with the face color representing the local temperature of each mesh element. Lighter shades represent higher temperatures and darker shades represent lower temperatures. Bottom left: same as top right, but with assigned spectral profiles plotted for three triangles across the surface. The He I λ4471 and He II λ4541 lines are plotted. Bottom right: final integrated spectral line profiles for the entire visible surface for the orientation shown in the other panels of this figure. Again, the He I λ4471 and He II λ4541 lines are plotted.
Current usage metrics show cumulative count of Article Views (full-text article views including HTML views, PDF and ePub downloads, according to the available data) and Abstracts Views on Vision4Press platform.
Data correspond to usage on the plateform after 2015. The current usage metrics is available 48-96 hours after online publication and is updated daily on week days.
Initial download of the metrics may take a while.