Fig. 2
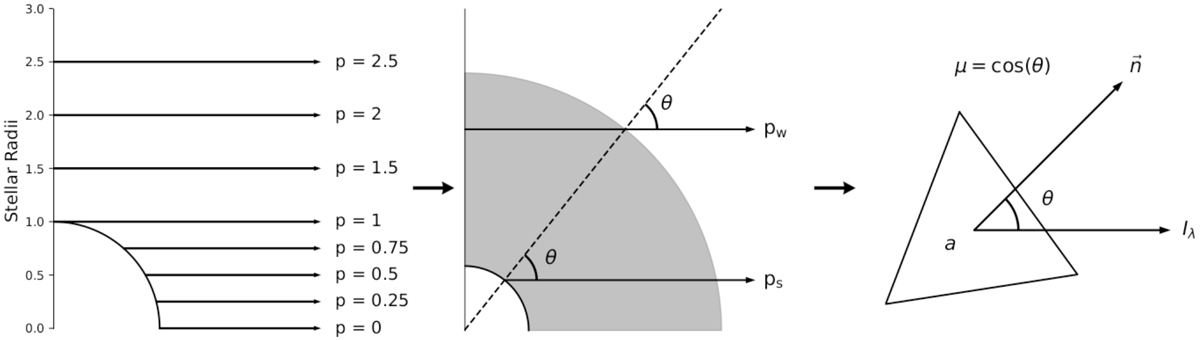
Left: sketch of the p-ray geometry. The quarter circle plotted in the bottom left represents the stellar surface and various p-rays leaving the system toward the observer (located to the right of the system) are indicated. The p-rays with values greater than 1 originate in the wind, which extends out to 120 stellar radii. Middle: sketch of the conversion from p-ray geometry to emergent intensity geometry. The quarter circle in the bottom left is the stellar surface and the shaded region represents the winds. For a given emergent angle, two p-rays are obtained, one originating from the stellar surface (ps) and one originating in the wind (pw)
Right: sketch of emergent intensity geometry. A patch of the stellar surface is plotted with two emerging rays, one normal to the surface (labeled ![]() ) and one pointing to the observer (labeled Iλ). θ is the emergent angle of the ray toward the observer and a represents the area of the patch.
) and one pointing to the observer (labeled Iλ). θ is the emergent angle of the ray toward the observer and a represents the area of the patch.
Current usage metrics show cumulative count of Article Views (full-text article views including HTML views, PDF and ePub downloads, according to the available data) and Abstracts Views on Vision4Press platform.
Data correspond to usage on the plateform after 2015. The current usage metrics is available 48-96 hours after online publication and is updated daily on week days.
Initial download of the metrics may take a while.