Fig. 5
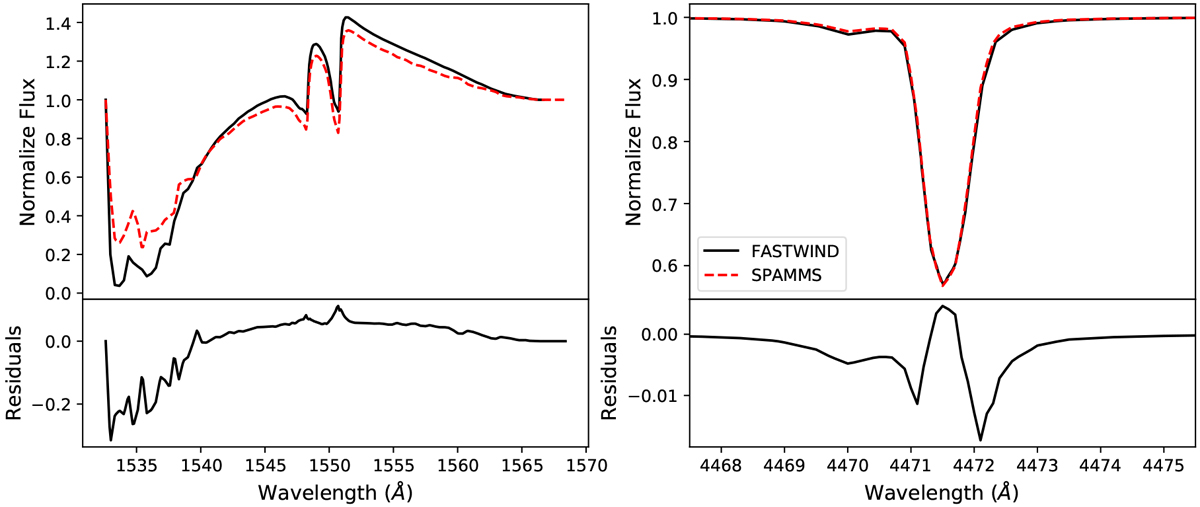
Comparison between line profiles generated using grid interpolation with SPAMMS and line profiles generated with FASTWIND for a system with the same parameters. SPAMMS line profiles are plotted in red dashed lines and FASTWIND line profiles are plotted in black, for a wind line C IV λ1548 on the left and a photospheric line H I λ4471 on the right. The residuals between the two methods are plotted beneath each.
Current usage metrics show cumulative count of Article Views (full-text article views including HTML views, PDF and ePub downloads, according to the available data) and Abstracts Views on Vision4Press platform.
Data correspond to usage on the plateform after 2015. The current usage metrics is available 48-96 hours after online publication and is updated daily on week days.
Initial download of the metrics may take a while.