Fig. 9
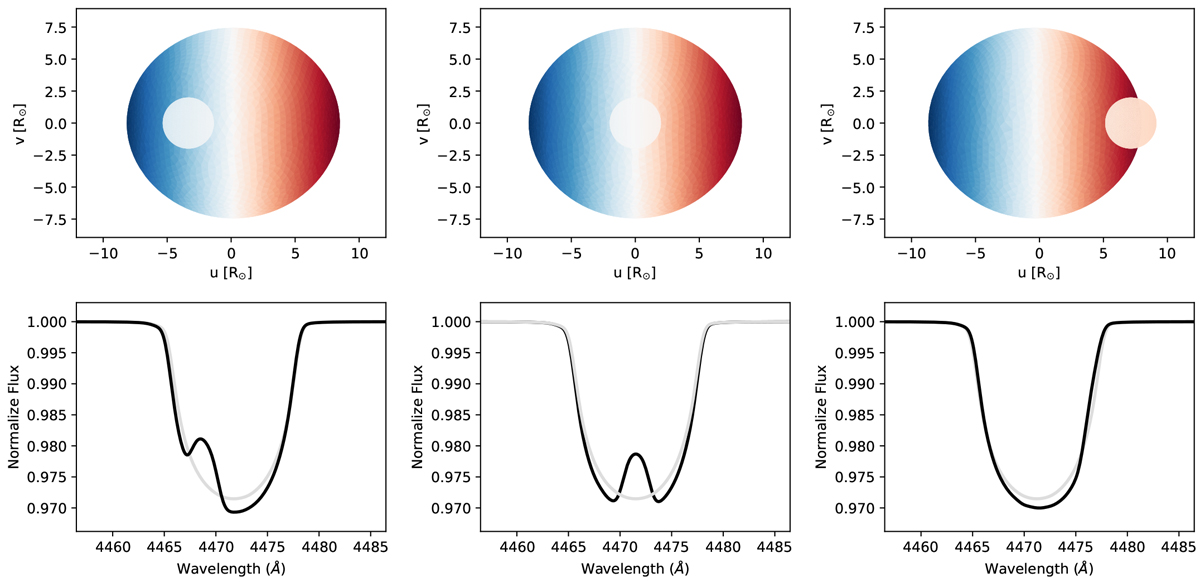
Example of the Rossiter-McLaughlin effect. Top panels: rapidly rotating star at different points during the eclipse. The face-color represents the radial velocity, with blue regions being blue-shifted and red regions being red-shifted. Bottom panels: modeled He I λ4471 spectral line plotted in black at the same phase as the respective top panel and the gray line represents the out of eclipse line profile.
Current usage metrics show cumulative count of Article Views (full-text article views including HTML views, PDF and ePub downloads, according to the available data) and Abstracts Views on Vision4Press platform.
Data correspond to usage on the plateform after 2015. The current usage metrics is available 48-96 hours after online publication and is updated daily on week days.
Initial download of the metrics may take a while.