Fig. 1.
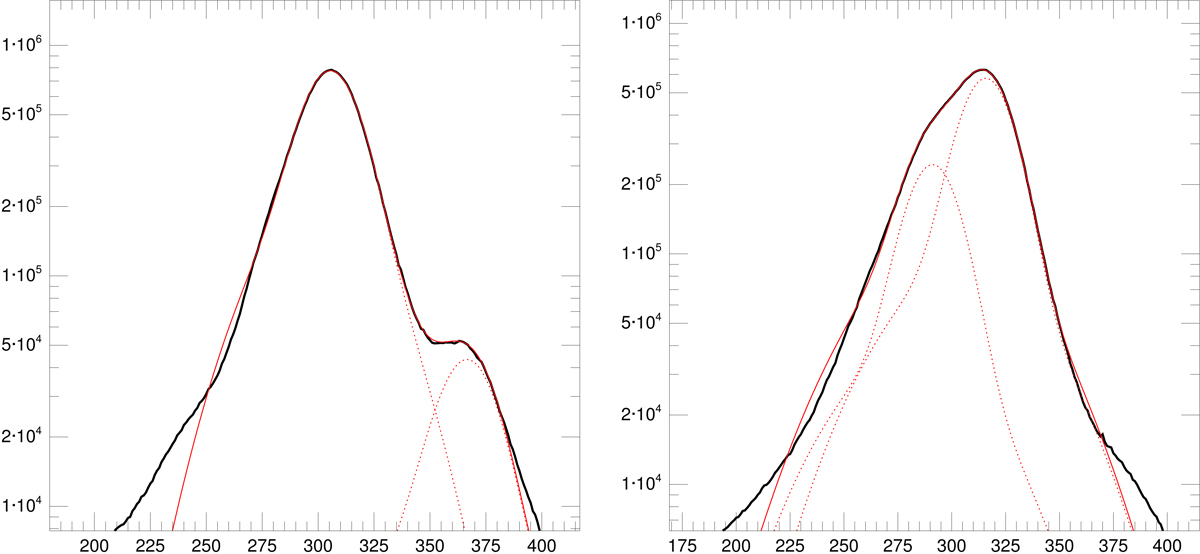
Spatially dithered spectral data collapsed along the trace used to fit the double spatial profile for two of the systems in this paper (ι Ori Aa,Ab, left, and HD 206267 Aa,Ab, right, in both cases for the 3936 grating setting). The horizontal axes show the 20x dithered spatial pixels (1 dithered pixel = 2.5 mas) and the vertical axes the counts (in log scale). In each plot the black line is the data, the solid red line the double (Aa+Ab) profile, and the dotted red lines the individual (Aa and Ab) profiles. The left plot is an example with relatively large separation and ΔB while the right plot shows an example with small separation and ΔB. See Fig. 1 of Maíz Apellániz et al. (2018) for equivalent plots using lucky spectroscopy.
Current usage metrics show cumulative count of Article Views (full-text article views including HTML views, PDF and ePub downloads, according to the available data) and Abstracts Views on Vision4Press platform.
Data correspond to usage on the plateform after 2015. The current usage metrics is available 48-96 hours after online publication and is updated daily on week days.
Initial download of the metrics may take a while.