Fig. 10.
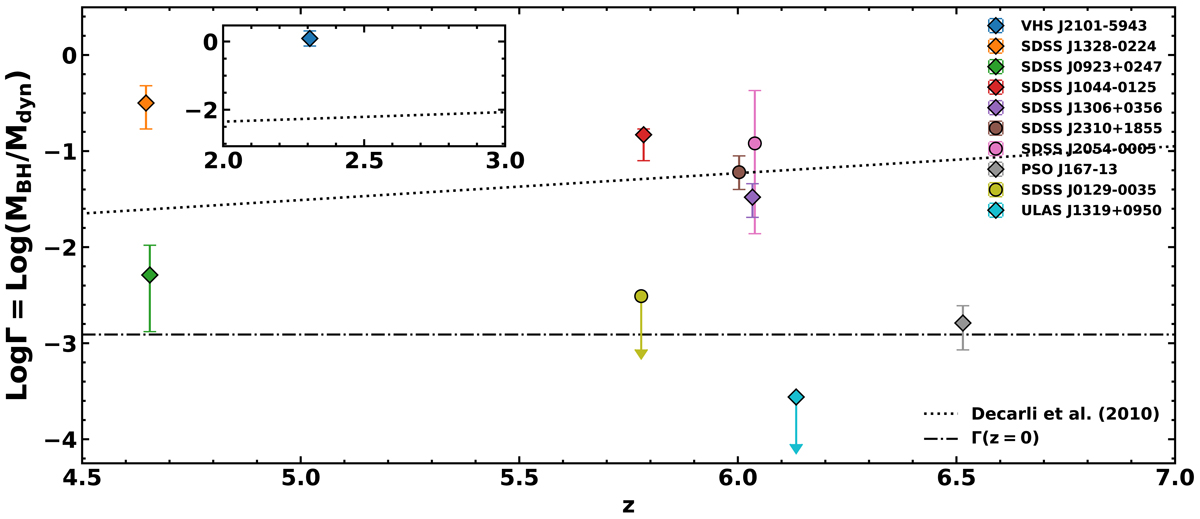
Evolution of Γ = MBH/Mdyn as a function of redshift z. The black dotted and dash-dotted lines represent, respectively, the relation found by Decarli et al. (2010) at z ≲ 3, and the corresponding ratio at z = 0. The inset panel shows the same plot at 2 < z < 3. In the case of SDSS J0129−0035 and ULAS J1319+0950 we inferred lower limits on dynamical masses (i.e. an upper limit on the ratio Γ). The circles indicate those sources which BH masses are estimated from bolometric luminosity assuming Eddington accretion.
Current usage metrics show cumulative count of Article Views (full-text article views including HTML views, PDF and ePub downloads, according to the available data) and Abstracts Views on Vision4Press platform.
Data correspond to usage on the plateform after 2015. The current usage metrics is available 48-96 hours after online publication and is updated daily on week days.
Initial download of the metrics may take a while.