Fig. 2
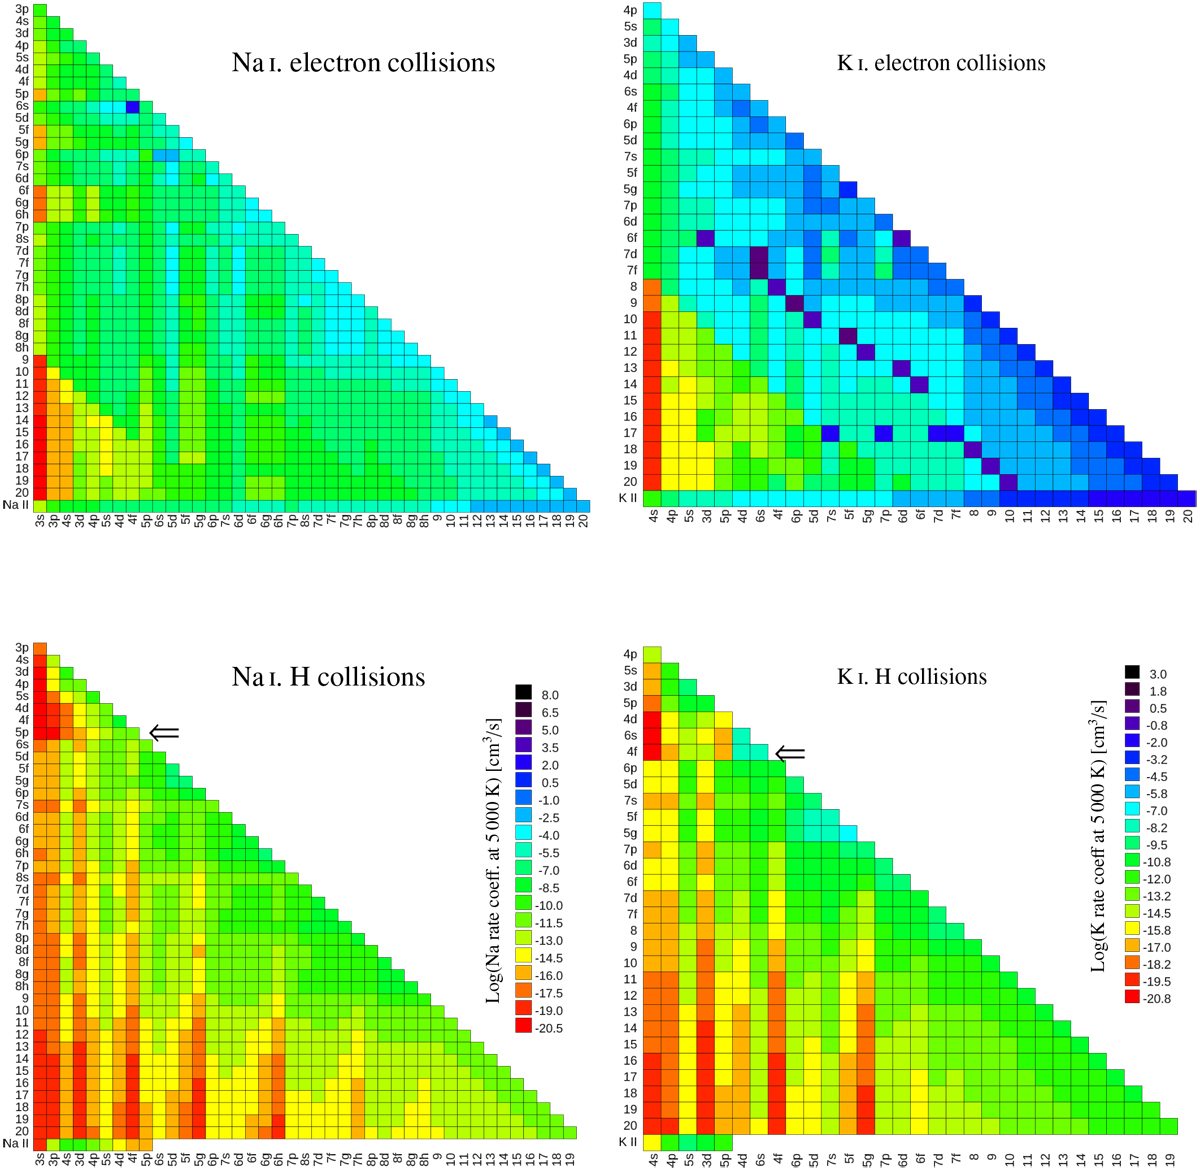
Rate coefficients of the electron related collisions (excitation and ionisation, top) and hydrogen related collisions (excitation and charge-exchange, bottom) for Na (left) and K (right). Initial levels of the transitions are labelled in rows and final levels are labelled in columns. The arrows point towards the transition that separates the hydrogen collisional excitation data from Barklem et al. (2012) and the data calculated using the formula from Kaulakys (1985). The colour scale at the left is for the Na Rates and the colour scale at the right is for the K rates.
Current usage metrics show cumulative count of Article Views (full-text article views including HTML views, PDF and ePub downloads, according to the available data) and Abstracts Views on Vision4Press platform.
Data correspond to usage on the plateform after 2015. The current usage metrics is available 48-96 hours after online publication and is updated daily on week days.
Initial download of the metrics may take a while.