Free Access
Fig. 2.
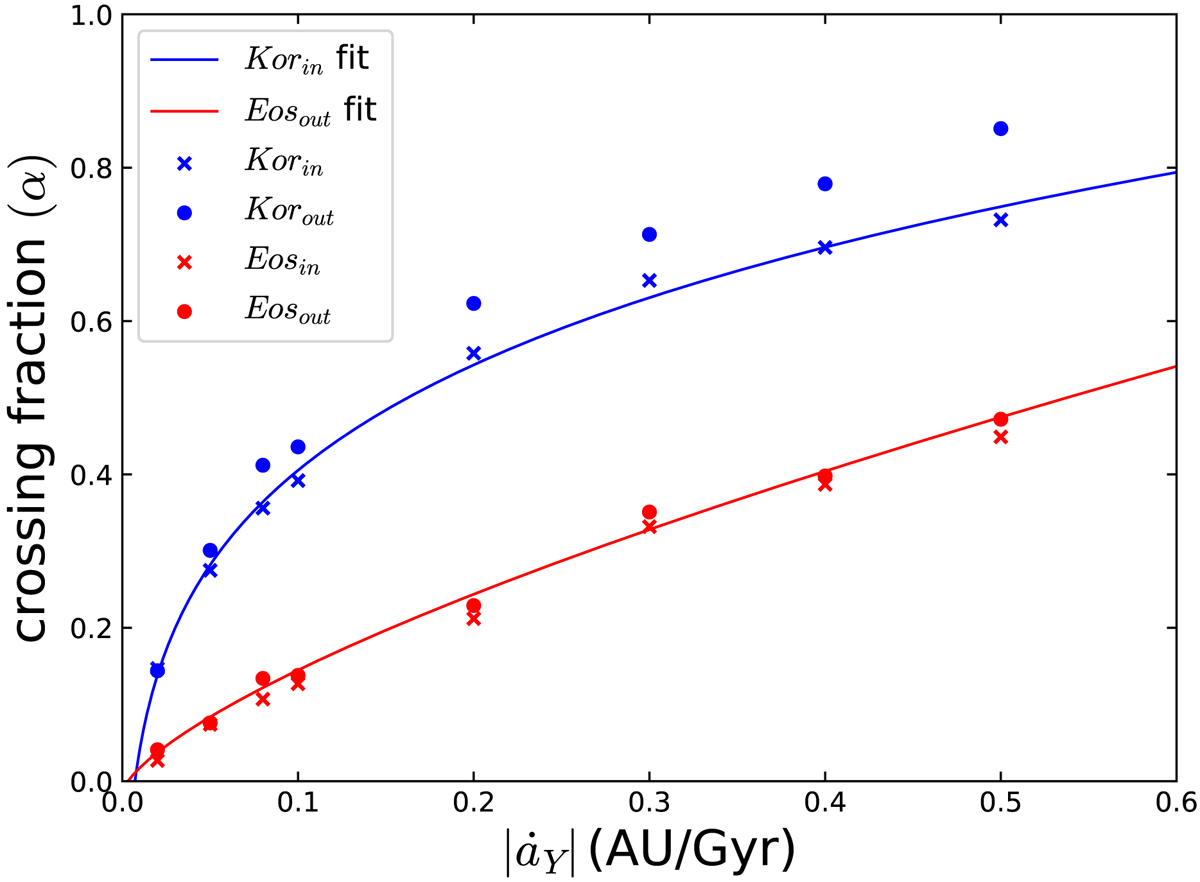
Crossing fraction against Yarkovsky drifting rate |ȧY|. Crosses and solid circles are for outward and inward migration, respectively, while blue and red indicate initial inclination i0 = 3° and 11°. Lines are fitting curves (see text).
Current usage metrics show cumulative count of Article Views (full-text article views including HTML views, PDF and ePub downloads, according to the available data) and Abstracts Views on Vision4Press platform.
Data correspond to usage on the plateform after 2015. The current usage metrics is available 48-96 hours after online publication and is updated daily on week days.
Initial download of the metrics may take a while.